Ever found it frustrating that your monitoring system alerts you in the middle of the night with a false service down alert? Ever found it difficult to trust the monitoring system alerts because of the network issues in your NOC? The solution to you, is distributed monitoring. The main aim of distributed monitoring is to produce the exact result of server service checks with the help of distributed, central monitoring servers and to avoid incorrect information.
Some times due to the network problems at NOC, services will show as down, though they are not. In the distributed Monitoring system, we setup the nagios in central, distributed monitoring servers with proper modification in the configuration files. The central server sends the notification mails and others will not. So we get the exact result instead of incorrect one. The results will be more accurate if these machines (monitoring machines in the distributed setup) are located at different locations.
Contents
- Requirement
- Nagios and Plugin installation
- Installation of nagios in the servers
- Installation of Nagios plugin
- Configure Nagios for Distributed monitoring
- NSCA addon module installation
- Configure the NSCA module and nagios configuration files
- How NSCA modules works for Distributed monitoring
- Future of the Distributed Monitoring
1 Requirement
- Linux or Free BSD OS to setup the nagios and NSCA addon module.
- If possible place distributed and central monitoring servers in different NOCs (It is to avoid nagios incorrect results due to network problems at NOC).
- Install nagios in each machine as per the following instructions
2 Nagios and Plugin installation
You need to do the following to install and setup the distributed nagios:
- Installation of nagios in the servers
- Converting the default nagios configuration file to a friendlier format
- Configuration and setup of NSCA module in the servers for the working of distributed nagios
2.1 Installation of Nagios
Check whether http, gcc, glibc, glibc-common,gd and gd-devel are installed in the machine. If they are not present, you need to do the installation using the following step:
yum install httpd gcc glibc glibc-common gd gd-devel
Create the nagios user account:
/usr/sbin/useradd nagios
passwd nagios
“nagcmd” group is required for external commands to be submitted through the web interface. Add both the nagios user and the apache user to the group.
/usr/sbin/groupadd nagcmd
/usr/sbin/usermod -G nagcmd nagios
/usr/sbin/usermod -G nagcmd apache
Download the nagios from http://www.nagios.org/download/
I used nagios-3.0b5 for the setup of distributed nagios.
You can do the following steps to install and configure the nagios.
tar xzf nagios-3.0b5.tar.gz
cd nagios-3.0b5
./configure --with-command-group=nagcmd
make all
make install
make install-init
make install-config
make install-commandmode
You need to customise the nagios configuration, according to your requirement. Modify the email address in /usr/local/nagios/etc/objects/contacts.cfg.
Run the following command to setup the web interface.
make install-webconf
The “nagiosadmin” login details to web interface can be setup using htpasswd.
htpasswd -c /usr/local/nagios/etc/htpasswd.users nagiosadmin
service httpd restart
After the completion of the above steps, you can see that apache is running fine but there are no contents in the folder /usr/local/nagios/libexec/. After the installation of nagios plugin as explained below, the relevant files will be created.
2.2 Installation of Nagios plugin
Do the following steps to install nagios plugin.
cd /usr/local/src
tar xzf nagios-plugins-1.4.7.tar.gz
cd nagios-plugins-1.4.7
./configure --with-nagios-user=nagios --with-nagios-group=nagios
make
make install
Add Nagios to the list of system services and have it automatically
start when the system boots.

chkconfig --add nagios
chkconfig nagios on

Check whether the nagios configurations using following command:
/usr/local/nagios/bin/nagios -v /usr/local/nagios/etc/nagios.cfg
If you find any difficulty in doing ./configure with –with option above, do the configuration using ./configure and give the proper ownership after the installation of plugins.
You can verify the nagios localhost entry using the http://<IP>/nagios with the nagiosadmin login details.
If you want to setup the nagios data in database, use “–with-mysql” option along with “./configure”. Also add the plugin NDOUtils to setup the nagios with database.
2.3 Nagios configuration file creation
The following configuration files will be created after the
above operations.

/usr/local/nagios/etc/objects/commands.cfg
/usr/local/nagios/etc/objects/contacts.cfg
/usr/local/nagios/etc/objects/timeperiods.cfg
/usr/local/nagios/etc/objects/templates.cfg
/usr/local/nagios/etc/objects/localhost.cfg
If you are keeping the same configuration, you will find difficulty to add new servers in it. You can find the above configuration details from /usr/local/nagios/etc/nagios.cfg.
3. Configure Nagios for Distributed monitoring
3.1 NSCA addon module installation
The purpose of this NSCA addon is to send service check results to a central monitoring server running Nagios in a secure manner. You can download from http://sourceforge.net/project/showfiles.php?group_id=26589. The main steps required for the setup of NSCA addon :
./configure
make all
After ‘make all’ is run, the binaries will be put in the src/ directory, which will then have to be installed manually. The selected remote machines that you want to communicate with the nsca daemon should be placed with the send_nsca program and associate config file (nsca.cfg). You can find the the installation instructions in the the NSCA addon README file.
The central server running Nagios should contain the nsca daemon and the configuration file (nsca.cfg)
The other modifications in nagios configuration file for the working of NSCA addon are mentioned below:
3.2 Configure the NSCA module and nagios configuration files
NSCA consists of two parts. The first part is a client program (send_nsca) run from a remote host.
The second part is the nsca daemon (nsca). This can be run either as a standalone daemon or under inetd. It listens to connections from client programs. This enables passive service check results to be obtained by the central server from one or more distributed servers.
A PROCESS_SVC_CHECK_RESULT command, along with the check results, will be inserted into the external command file. So when the next time Nagios checks for external commands, the passive service check information that was sent from the distributed server will be found and Nagios will process it.
3.3a Central server configuration file modifications:
The following modifications should be made on Central Nagios Server setting:
The central server has the web interface installed (optional, but recommended). Here I have considered as the nagios installation path is /usr/local/nagios/. Do the following modification in nagios.cfg :
enable_notifications=1
execute_service_checks=1
check_external_commands=1
accept_passive_service_checks=1
Add the following entry in commands.cfg file. You can find this in nagios etc folder.
define command{
    command_name    service-is-stale
    command_line    /usr/local/nagios/libexec/staleservice.sh
    }
Create the file “staleservice.sh” with following content :
#!/bin/sh
/bin/echo "CRITICAL: Service results are stale!"
exit 2
3.3b Distributed server configuration file modifications:
You need to install the nsca addon in both the central server and distributed servers with proper modification.
The client program (send_nsca) which is run from a remote host (distributed) and is used to send the service check results to another server. Here it sends results to central server.
You don’t need to install the web interface or have notifications sent out from the server, as all these will be handled by the central server. The other configuration modification you need to do in the Distributed server nagios.cfg are:
enable_notifications=0
obsess_over_services=1
ocsp_command=submit_check_result
enable_event_handlers=1
Define the following command in commands.cfg (or checkcommands.cfg) as per your nagios setting:
define command{
command_name    submit_check_result
command_line    /usr/local/nagios/libexec/eventhandlers/submit_check_result
$HOSTNAME$ '$SERVICEDESC$' $SERVICESTATE$ '$OUTPUT$'
        }
Create the file submit_check_result (Here it is /usr/local/nagios/libexec/eventhandlers/submit_check_result).
    #!/bin/sh

    # Arguments:
    #  $1 = host_name
    #  $2 = svc_description
    #  $3 = state_string
    #  $4 = plugin_output   #
    return_code=-1

    case "$3" in
            OK)
                    return_code=0
                    ;;
            WARNING)
                    return_code=1
                    ;;
            CRITICAL)
                    return_code=2
                    ;;
            UNKNOWN)
                    return_code=-1
                    ;;
    esac
# The command below should be typed in one line
# I split it into three lines for readability

    /bin/printf "%st%st%st%sn" "$1" "$2" "$return_code" "$4" |
/usr/local/nagios/bin/send_nsca central_server
-c /usr/local/nagios/etc/send_nsca.cfg
The submit_check_result will work only if we call it explicitly. This can be done using “ochp_command=obsessive_host_handler”.
The content of the obsessive_host_handler is below:
# OBSESSIVE_SVC_HANDLER
# This script is intended to run as the OCSP command
# on a distributed monitoring server.  The script calls
# submit_check_result_via_nsca to send the service check
# results to the central monitoring server.
#
# Arguments:
#  $1 = host_name (Short name of host that the service is
#       associated with)
#  $2 = state_string (A string representing the status of
#       the given service - "OK", "WARNING", "CRITICAL"
#       or "UNKNOWN")
#  $3 = plugin_output (A text string that should be used
#       as the plugin output for the service checks)
#

# Location of the submit_check_result_via_nsca script
SubmitCmd="/usr/local/nagios/libexec/eventhandlers/submit_check_result"

# Convert the state string to the corresponding return code
return_code=-1

case "$2" in
        UP)
                return_code=0
                ;;
        DOWN)
                return_code=1
                ;;
        UNREACHEBLE)
                return_code=2
                ;;
esac

# Send the service check results to the central monitoring server
$SubmitCmd "$1" $return_code "$3"
Also define obsessive_host_handler in commands.cfg (or checkcommands.cfg as per the setting):
define command{
        command_name obsessive_host_handler
        command_line    /usr/local/nagios/libexec/obsessive_host_handler
$HOSTNAME$ $SERVICESTATEID$ '$SERVICEOUTPUT$'
}
You need to mention the same encryption_method and password in both the send_nsca.cfg (distributed) and nsca.cfg (Central server)
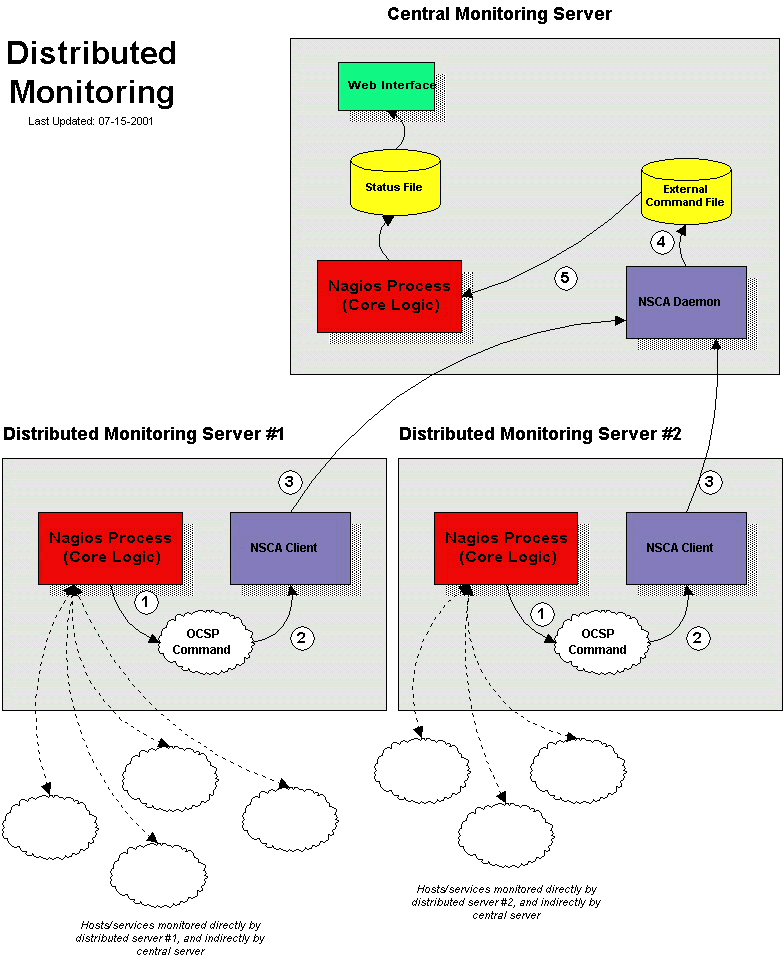
3.4 How NSCA module works?
After the distributed server finishes executing a service check, it executes the command which we defined by the ocsp_command variable (submit_check_result script).
The submit_check_result script pipes the service check information (host name, description, return code, and output) to the send_nsca client program. The send_nsca program transmits the service check information to the nsca daemon on the central monitoring server.
The nsca daemon on the central server takes the service check information and writes it to the external command file. The Nagios process on the central server reads the external command file and processes the passive service check information that originated from the distributed monitoring server.
Conclusion
To Perform host checks in distributed monitoring : The central server should have passive host checks enabled (required) The distributed server is configured to obsess over hosts. The distributed server has an ochp command defined. The NSCA module should be installed.
If the service checks in your server are very critical for you, the NOC network issues may result in false alerts, which cannot be accepted. Here comes the need for distributed monitoring. However the trade off between buying multiple servers for distributed nagios and the criticality of your monitoring should be carefully analyzed before implementation.
REFERENCE:
 About the author:
Jospeph Symon has been working in Bobcares for more than 2 years. He has marked his presence in the company by his contributions towards enriching the knowledge level in the company. He is a linux expert, especially in installing and configuring systems and customizing them for specific needs. He is also passionate about learning new techologies.

0 Comments