

Strategic Dashboards
Track strategic goals and high-level performance by combining data from CRMs, billing platforms, and databases to monitor revenue growth, customer retention, profitability, and business objectives.



Businesses generate data every day, but it is often stored across different systems, making it difficult to use for daily decisions. Teams spend time collecting, organizing, and reviewing information before they can identify trends or measure performance.
Data analytics tackles this challenge by gathering, structuring, and analyzing business data to turn it into valuable insights. Those insights are then presented through real-time analytics dashboards.
In short, a business analytics dashboard gives organizations a unified view of their data and highlights important trends. Custom data analytics platforms also support AI-powered analysis and natural language queries, helping teams find answers faster.

Business data remains scattered across multiple systems.
Manual reporting takes time and slows business decision-making.
Different teams rely on inconsistent business metrics.
Important trends, risks, and business opportunities remain unnoticed.
Data from different sources is difficult to combine.
Defining the right business metrics takes longer than expected.
Standard analytics dashboard examples often do not fit business reporting needs.
Cleaning and organizing historical data requires extra effort.
A data analytics dashboard becomes outdated without regular updates.
Data sources require time to be integrated with the system.
User adoption remains low if dashboards are difficult to use.
Ongoing maintenance is needed as business requirements change.
The need for data analytics becomes clear when teams spend more time collecting, validating, and preparing data than using it for decision-making. As the business grows, manual reporting slows, data is spread across multiple systems, and obtaining accurate insights takes longer. This makes it difficult for decision-makers to respond quickly. The solution is to use a dashboard for data analysis.
Weekly or monthly reports take too long to prepare
Different teams report different numbers for the same metrics
Business decisions are made without reliable data
Customer and business trends are caught too late
Leadership lacks real-time visibility into business performance
From scattered business systems to one trusted source of truth, delivered through custom dashboards and AI-powered insights.
HubSpot, salesforce
Stripe
Zendesk
MySQL, PostgreSQL
APIs, CDC and scheduled extracts
Airflow, Python, SQLAlchemy
Structural checks on arrival: schema, completeness, file integrity
Append-only loads, source data untouched
ClickHouse, PostgreSQL, Redis cache
Raw, as ingested
Clean and validate
Clean and validate
Cleaned, validated
Model and aggregate
Model and aggregate
Modeled for analytics
Rows that fail silver checks are held for review and alerts, not dropped.
Served from Gold, cached redis
FastAPI, REST, GraphQL
scikit-learn, OpenRouter
Aggregated masked inputs only
WeasyPrint, openpyxl
Consumed by
React, Typescript, Reacharts, D3, scheduled reports
Across every layer
Grafana, Prometheus, Sentry, plus freshness, volumes and quality checks
Assess control by layer, Docker, AWS, GCP
Make better use of your business data with dashboards built around your reporting needs. Bobcares brings data from different systems into a single view, helping your team track performance, investigate changes, and make decisions based on reliable information.
Track strategic goals and high-level performance by combining data from CRMs, billing platforms, and databases to monitor revenue growth, customer retention, profitability, and business objectives.

Bring key business metrics into one view with a visual dashboard that tracks daily operations, live performance, and short-term trends, helping teams identify issues and take timely action.

Monitor weekly and monthly performance, track departmental trends, and measure progress toward short-term goals and initiatives to help managers identify gaps and adjust priorities.

Monitor metrics across business operations and IT systems as they change. Track service performance and transaction volumes, and support activity to stop issues and respond as they occur.
Reporting
Automated reports replace hours of manual reporting work
Data accuracy
One trusted data source keeps business reporting consistent
Decision speed
Real-time dashboards cut decision-making time by 60 to 80%
AI insights
AI identifies key trends faster than manual data analysis
Easy queries
Users can query data in plain language without using SQL
Risk detection
Detect churn and business risks 4 to 8 weeks earlier
Cost visibility
Track costs in real time with automated anomaly alerts

Most analytics initiatives fail to deliver business value because they focus on a dashboard rather than a business problem, resulting in a less effective data analytics dashboard. Data stays scattered, reports become outdated, and teams stop using the platform because it does not support their daily work. Bobcares takes a business-first approach to data analytics and dashboard development. We create custom analytics platforms that integrate all your data sources, automate reporting, and deliver AI-powered insights on a web analytics dashboard to help you make quicker decisions. All solutions are built with your business objectives, user roles, and reporting needs in mind, to help your teams use data with confidence.
Experience building and managing analytics platforms for real business operations
Custom dashboards designed around your business processes and user roles
AI-powered insights and natural language queries are built into the platform
Custom data pipelines for cloud, on-premises, and legacy systems
End-to-end delivery covering building data analytics, dashboards, and AI integration
Ongoing platform support to keep reports and dashboards accurate as data changes
Talk to Bobcares experts to explore the right solution for your business
We provide end-to-end data analytics dashboard development services, from data integration and dashboard design to AI-powered analytics and automated reporting. Our solutions are tailored to your business data, reporting needs, and decision-making processes.
We support businesses worldwide with reliable, expert-driven solutions. Trusted for our consistency, speed, and commitment to quality.


We also provide supporting services that extend the value of your data analytics dashboard platform and help turn your data into business growth.
We work with the Bobcares team across numerous brands and technologies, building on a relationship that spans many years. The team provide exceptional support, consistently demonstrating expertise, vigilance, and tenacity. Nothing is ever too much trouble for the team leader and her highly capable team, and their dedication and commitment are greatly appreciated.
Easyspace Division
Iomart Group
Bobcares has been an extension of our team at DNN4Less. We're a small shop running a big mix of platforms (cPanel/Linux, Windows/IIS, Plesk, DNN, email, and more), and their engineers handle our customer support with the technical depth and responsiveness we need. The team takes ownership of issues, knows when to escalate, and communicates clearly with our customers. Having Bobcares in our corner lets us focus on infrastructure and growth, knowing our customers are in good hands.

Jessie Haggerty
Hosting Manager, DNN4Less

Bobcares helped me with the configuration of server side settings that allowed for our development team to use Github with cPanel. Bobcares also guided me to another solution which may be better for my purposes. As always, Bobcares is looking out for my best interests and proactively offering ideas and recommendations. I highly recommend Bobcares for all of your technology support needs!
Matthew Owen
Founder, FastTrack CEO
We had a quick turnaround support from Ameer from BobCares team to fix a Cname issue we were facing with email delivery. This was rectified by Ameer instantly. We appreciate BC's support at all times and trust them and their expertise! 5 Stars and always reliable!

Shamil Abdul Latheef
Sr. Manager - Digital Biz, Chrysalis Digital

Bobcares provides comprehensive end-to-end product lifecycle support for ReformRX. From developing and maintaining the mobile app to handling customer support and Azure operations, no task was too small or too complex for their team. Their responsiveness to change, consistent high-quality deliverables, and can-do attitude helped us significantly scale the ReformRX app’s functionality. Bobcares’ team and leadership are engaged, reliable, and trusted partners for our IT services.
Kripa Krishnan
Product Lead, Reform RX

I wholeheartedly advise any company that needs an exceptional support team to take care of their internet and mail server to get in touch with Bobcares. They will experience exceptional, swift, and efficient service. Don’t wait—just go ahead and join them!
Cherif Bedran
Founder and CEO, Information Management Limited

Bobcares is a great service! I've been a user for nearly two years and whether it's regular server monitoring or responding to unexpected downtime, Bobcares has been there and done a good job. Most recently, we had an unexpected downed SQL server that Bobcares noticed through monitoring and brought back up to functioning in under an hour. Great work!
Ibrahim Chishti
Director of Technology, IMC DIGITAL UNIVERSE, INC
We have had many urgent issues with our Moodle instance and the team at Bobcares came to our rescue. This specific issue was no exception. Our production site was not loading, instead we were receiving this message, "error reading from database". However, I reached out to the techs at Bobcares and they rescued us in a short period of time! Our site is up and running again!

Sergio Estridge
E-Learning Manager, H. Lavity Stoutt Community College
We work with the Bobcares team across numerous brands and technologies, building on a relationship that spans many years. The team provide exceptional support, consistently demonstrating expertise, vigilance, and tenacity. Nothing is ever too much trouble for the team leader and her highly capable team, and their dedication and commitment are greatly appreciated.
Easyspace Division
Iomart Group
Bobcares has been an extension of our team at DNN4Less. We're a small shop running a big mix of platforms (cPanel/Linux, Windows/IIS, Plesk, DNN, email, and more), and their engineers handle our customer support with the technical depth and responsiveness we need. The team takes ownership of issues, knows when to escalate, and communicates clearly with our customers. Having Bobcares in our corner lets us focus on infrastructure and growth, knowing our customers are in good hands.
Jessie Haggerty
Hosting Manager, DNN4Less
Bobcares helped me with the configuration of server side settings that allowed for our development team to use Github with cPanel. Bobcares also guided me to another solution which may be better for my purposes. As always, Bobcares is looking out for my best interests and proactively offering ideas and recommendations. I highly recommend Bobcares for all of your technology support needs!
Matthew Owen
Founder, FastTrack CEO
We had a quick turnaround support from Ameer from BobCares team to fix a Cname issue we were facing with email delivery. This was rectified by Ameer instantly. We appreciate BC's support at all times and trust them and their expertise! 5 Stars and always reliable!
Shamil Abdul Latheef
Sr. Manager - Digital Biz, Chrysalis Digital
Bobcares provides comprehensive end-to-end product lifecycle support for ReformRX. From developing and maintaining the mobile app to handling customer support and Azure operations, no task was too small or too complex for their team. Their responsiveness to change, consistent high-quality deliverables, and can-do attitude helped us significantly scale the ReformRX app’s functionality. Bobcares’ team and leadership are engaged, reliable, and trusted partners for our IT services.
Kripa Krishnan
Product Lead, Reform RX
I wholeheartedly advise any company that needs an exceptional support team to take care of their internet and mail server to get in touch with Bobcares. They will experience exceptional, swift, and efficient service. Don’t wait—just go ahead and join them!
Cherif Bedran
Founder and CEO, Information Management Limited
Bobcares is a great service! I've been a user for nearly two years and whether it's regular server monitoring or responding to unexpected downtime, Bobcares has been there and done a good job. Most recently, we had an unexpected downed SQL server that Bobcares noticed through monitoring and brought back up to functioning in under an hour. Great work!
Ibrahim Chishti
Director of Technology, IMC DIGITAL UNIVERSE, INC
We have had many urgent issues with our Moodle instance and the team at Bobcares came to our rescue. This specific issue was no exception. Our production site was not loading, instead we were receiving this message, "error reading from database". However, I reached out to the techs at Bobcares and they rescued us in a short period of time! Our site is up and running again!
Sergio Estridge
E-Learning Manager, H. Lavity Stoutt Community College
Every data analytics project follows a structured process to deliver accurate data, useful insights, and data visualization dashboards.
Step 1
Step 2
Step 3
Step 4
Step 5
Step 6
Many analytics platforms offer data analytics dashboards but fail to deliver meaningful business insights. Reports become outdated, dashboards lose adoption, and data quality declines over time. We work on creating reliable analytics platforms that are simple to use and useful as your business grows.
Dashboards built around users and goals
Insights and natural language reporting included
Accurate reports from dependable pipelines
Easy to manage and expand over time
Ongoing monitoring and maintenance
Support for new, upgraded, or managed platforms
Poor data quality leads to incorrect dashboard analytics reports
Data validation and monitoring detect issues before dashboards update.
Pipeline failures after source system changes
Schema changes are tracked, with alerts for ingestion failures.
Low dashboard adoption among business users
User workflows guide dashboard design before development begins.
AI insights become less accurate over time
AI models are reviewed regularly, with user feedback improving accuracy.
Dashboard performance slowing as data volume grows
Query tuning and caching maintain performance as data grows.
Restricted data visible to unauthorized users
Access controls are verified before deployment.
Historical data issues affecting trend analysis
Historical data is reviewed and cleaned before pipeline development.
Poor data quality leads to incorrect dashboard analytics reports
Pipeline failures after source system changes
Low dashboard adoption among business users
AI insights become less accurate over time
Dashboard performance slowing as data volume grows
Restricted data visible to unauthorized users
Historical data issues affecting trend analysis
Data validation and monitoring detect issues before dashboards update.
Schema changes are tracked, with alerts for ingestion failures.
User workflows guide dashboard design before development begins.
AI models are reviewed regularly, with user feedback improving accuracy.
Query tuning and caching maintain performance as data grows.
Access controls are verified before deployment.
Historical data is reviewed and cleaned before pipeline development.




Python, Pandas, SQLAlchemy, Apache Airflow


OpenRouter, sentence-transformers, scikit-learn, Isolation Forest


React, TypeScript, Recharts, D3.js, Tailwind CSS, Vite


FastAPI, Laravel, RESTful APIs, GraphQL


PostgreSQL, MySQL, Redis, ClickHouse


Dompdf, WeasyPrint, Jinja2, openpyxl


n8n, Celery, Webhooks


Grafana, Prometheus, Sentry


AWS, GCP, Docker, Nginx


HubSpot, Salesforce, Stripe, Zendesk, REST APIs
We offer two engagement models based on your analytics goals and ongoing development needs.
In this model, we design, build, test, and deploy analytics dashboards. We also provide documentation and a knowledge transfer session. Best suited for businesses with a clear project scope.
A dedicated Bobcares engineering team works as an extension of your team. We build new analytics dashboard solutions, connect additional data sources, improve AI insight models, and keep your data pipelines running reliably.
Data discovery and requirements
1 to 2 weeksData architecture and design
1 weekData pipeline development
2 to 4 weeksDashboard design and build
2 to 3 weeksAI insight integration
1 to 2 weeksTesting and deployment
1 weekDocumentation and handoff
3 to 5 daysPipeline maintenance and updates
Continuous*Standard timelines may vary based on the project.
Development, hosting, AI usage, and integrations
Ongoing monitoring and maintenance support
Consolidated client health scores, support volume trends, and service revenue dashboards help providers understand account performance and identify clients that may need attention.
Product usage analytics, subscription revenue tracking, churn prediction, and feature adoption metrics give SaaS teams insight into customer engagement and retention.
Sales, inventory, customer purchasing patterns, and campaign attribution dashboards help businesses evaluate sales performance and understand which marketing activities drive conversions.
Transaction analytics, risk indicators, compliance reports, and revenue dashboards provide visibility into financial activity and operational performance.
Analytics dashboards bring together relevant patient outcome measures, operational metrics, and compliance data to support reporting and performance reviews.
Project profitability, resource utilization, and client health dashboards help firms assess delivery performance, resource allocation, and account value.
Our results reflect the value our data analytics dashboard solutions deliver.
Analytics platforms support client insights
Average analytics platform implementation
Reduced manual reporting effort
Reliable data pipeline operations
Identify at-risk accounts earlier
Tested with operational data
Secure analytics environments
Ongoing monitoring included
Bobcares provides 24/7 proactive monitoring to help keep your platform operating reliably. Our monitoring systems continuously track the health and performance of critical components, automatically alerting our engineers when issues require attention.
Bobcares provides structured exit support so your team can take over with confidence.
A B2B SaaS company was collecting feedback through Google Reviews, Trustpilot, surveys, and support channels, but lacked a centralized customer feedback management system. Teams spent 12 hours per week manually organizing feedback, while negative sentiment was identified too late.
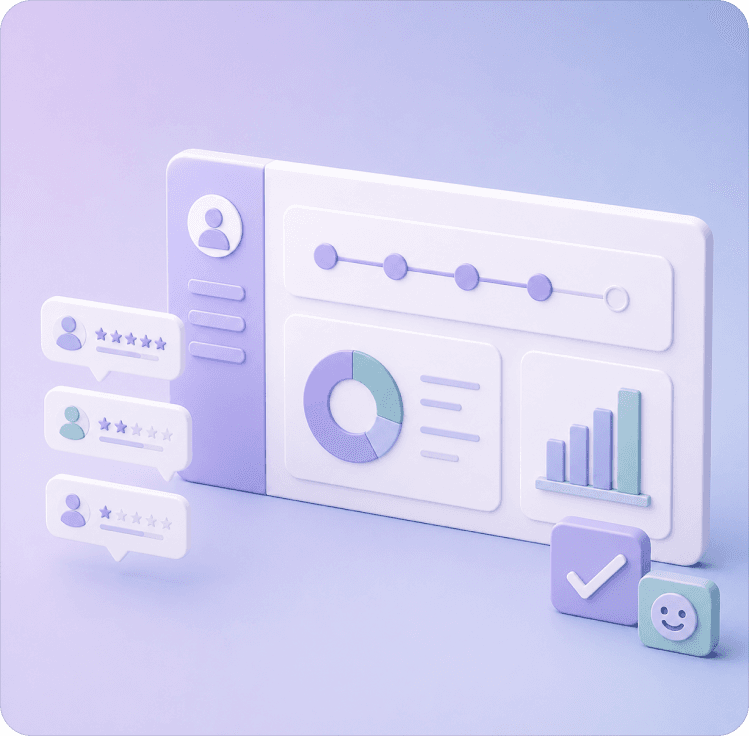
A managed hosting company with over 5,000 clients built an email survey-based feedback system and a manual report-based quarterly feedback system for its six departments.
An e-commerce business received hundreds of reviews across Google Business, Trustpilot, and Facebook, but could not connect them with customer orders or product history.
A B2B SaaS company was collecting feedback through Google Reviews, Trustpilot, surveys, and support channels, but lacked a centralized customer feedback management system. Teams spent 12 hours per week manually organizing feedback, while negative sentiment was identified too late.
A managed hosting company with over 5,000 clients built an email survey-based feedback system and a manual report-based quarterly feedback system for its six departments.
An e-commerce business received hundreds of reviews across Google Business, Trustpilot, and Facebook, but could not connect them with customer orders or product history.
Get actionable solutions for your business