


Optimize Varnish Cache Memory Usage with the right sizing, monitoring, and configuration strategies. Learn how to reduce evictions, improve cache hit ratio, and boost website performance. Our Support Engineers are here to help.
Updated for Varnish 7.x and modern production environments
Looking for the right way to analyze and optimize Varnish cache memory usage?
Varnish Cache remains one of the most powerful HTTP accelerators for improving website speed and reducing backend load. However, incorrect memory sizing and improper storage configuration can lead to cache evictions, reduced hit ratio, and poor performance.
At Bobcares, we regularly help businesses fine-tune Varnish configurations as part of our Server Management Services. In this guide, we’ll explain how to properly analyze memory usage and optimize Varnish for modern workloads.
An Overview
What Is Varnish Cache?
Varnish Cache is an open-source HTTP accelerator that caches web content and reduces load on backend servers.
It works as a reverse proxy placed between:
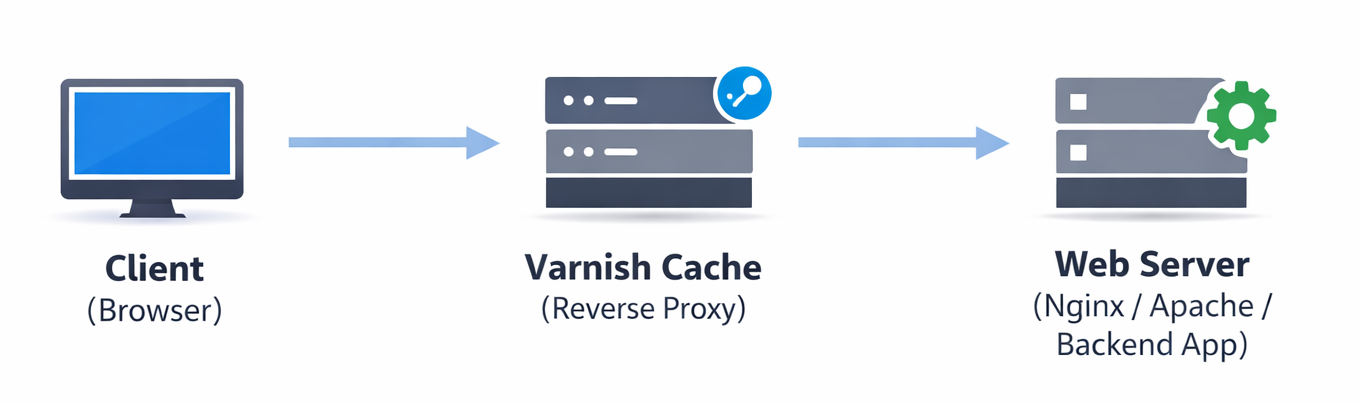
Instead of hitting the web server for every request, Varnish serves cached content directly from memory, dramatically improving response time and scalability.
Modern Varnish (7.x) supports:
- High-performance in-memory caching
- Disk-backed storage
- Flexible cache control with VCL (Varnish Configuration Language)
- Advanced monitoring via varnishstat and Prometheus exporters
How Varnish Stores Cached Data
Varnish uses pluggable storage backends. The most common ones are:
- malloc (Memory Storage)
- Stores objects in RAM
- Fastest option
- Best for high-traffic websites
- Configured using: -s malloc,4G
- file (Disk Storage)
- Stores cache on disk
- Suitable for large datasets
- Slower than memory
- Example: -s file,/var/lib/varnish/cache.bin,10G
Each cached object includes metadata overhead (roughly ~1KB per object). This means that many small objects can consume more memory than expected and the configured size is not equal to usable object storage.
Proper sizing must consider this overhead.
Why Incorrect Cache Size Causes Performance Issues
If your cache is too small:
- Objects get evicted too frequently
- Cache hit ratio drops
- Backend load increases
- Site becomes slower instead of faster
One of the most common indicators of insufficient memory is excessive LRU (Least Recently Used) evictions.
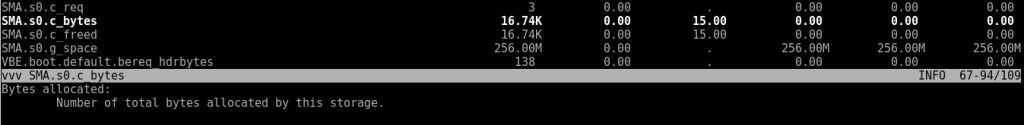
How to Check Varnish Memory Usage
The primary tool for checking usage is: varnishstat
| Metric | Meaning | What to Watch |
|---|---|---|
| MAIN.n_lru_nuked | Objects evicted due to memory pressure | If increasing rapidly → cache too small |
| SMA.s0.g_bytes | Bytes currently allocated | Total used memory |
| SMA.s0.g_space | Free space remaining | If near zero → memory exhaustion |
| MAIN.cache_hit | Number of cache hits | Should increase steadily |
| MAIN.cache_miss | Backend requests | High value indicates poor caching |
Warning Sign
If:
- n_lru_nuked keeps increasing
- g_space is consistently low
- Backend load is high
Your cache size is insufficient.
Real-World Optimization Example
A customer running Varnish with Nginx experienced site slowness despite enabling caching.
Initial configuration: –s malloc,512M
Using varnishstat, we observed:
- Increasing n_lru_nuked
- Very low free space (g_space)
- High backend requests
Solution
We increased cache size to: -s malloc,1G
After doubling the memory:
- LRU evictions dropped
- Hit ratio improved
- Backend load reduced
- Website speed stabilized
How to Calculate the Right Cache Size
Our experts suggest following this approach:
- First, estimate the size of frequently accessed pages and assets.
- Then increase the cache size until n_lru_nuked stabilizes, the hit ratio improves, and free space remains available during peak traffic.
- If you serve many small files (APIs, JSON responses, dynamic fragments), increase the buffer size to account for metadata overhead.
Conclusion
Varnish delivers excellent performance only when properly sized and monitored. Incorrect memory allocation can cause frequent evictions, low hit ratios, and increased backend load. Optimizing Varnish means monitoring LRU metrics, adjusting malloc storage, normalizing URLs, setting proper TTLs, and implementing structured monitoring. If you’re experiencing issues, our Support engineers can help fine-tune your configuration for peak performance.
