


Please Note: This article is part of our historical archive. Because it was published a while ago, some of the information, links, or context may now be outdated.
High load, aka high load average is the most common reason for business downtime in the web hosting industry.
Applications freeze, websites timeout, and customers abandon cart.
Yeah, we hate it too. That’s why, here at Bobcares, our Experienced Server Admins monitor our customer’s servers 24/7 and fix load issues in as little as 5 minutes.
Today, we’ll take a quick look at how to quickly troubleshoot load spikes in Linux servers.
High load average – What is it really?
A server functions with a limited set of resources. For eg., an average server these days will have 8 GB RAM, 4 processors, 75 IOPS SATA II hard disks, and 1 Gigabit NIC cards.
Now, let’s assume one user decided to backup their account. If that process occupies 7.5 GB of RAM, other users or services in the system have to wait for that process to get over.
The longer the backup takes, the longer the wait queue. The length of the queue is represented as server load. So, a server running at load avg. 20, will have a longer wait queue than a server at load avg. 10.
[ Repeated high server load can ruin your business! Don’t wait anymore. Our expert server specialists will keep your servers stable. ]
Why FAST troubleshooting is important
When a server is under high load, chances are that the number of processes in the “wait” queue are growing each second.
The commands take longer to execute, and soon the server could become non-responsive, leading to a reboot. So, it is important to kill the source of the server load as soon as possible.
 In our Server support team, we have a concept called “The Golden Minute”. It says that the best chance to recover from a load spike is in the first minute. Our engineers keep a close eye on the monitoring system 24/7, and immediately log on to the server if a load spike is detected. It is due to this quick reaction and expert mitigation that we’re able to achieve close to 100% server uptime for our customers .
Blessen Cherian
Member of Executive Group, Bobcares
How to troubleshoot a load spike really fast?
It is common for people to try out familiar commands when faced with a high load situation. But without a sound strategy it is just wasted time.
Bobcares support techs use a principle called go from what you know to what you don’t.
When we get a high load notification, there’s one thing we know for sure. There’s at least one server resource (RAM, CPU, I/O, etc.) that’s being abused.
- So, the first step is to find out which resource is being abused.
- The next is to find out which service is using that resource. It could be the web server, database server, mail server, or some other service.
- Once we find out the service, we then find out which user in that service is actually abusing the server.
FAST Linux server load troubleshooting
To show how this concept works in reality, we’ll take an example of a high load situation we recently fixed in a CentOS Linux server. Here are the steps we followed:
- Find the over-loaded resource
- Find the service hogging that resource
- Find the virtual host over-using that service
1. Find the over-loaded resource
Our support techs use different tools for different types of servers. For physical servers or hardware virtualized servers, we’ve found atop to be a good fit. In an OS virtualized server, we use the top command, and if it’s a VPS node we use vztop.
The goal here is to locate which one of the resources; viz, CPU, Memory, Disk or Network that is getting hogged. In this case, we used atop, as it was a dedicated server.
We ran the command “atop -Aac“. It showed the accumulated usage of resources for each process, sorted automatically by the most used resource, and the command details. This gave the below output.

atop disk usage data
We could see that the most used resource is disk and is marked as ADSK. From the highlighted summary we saw that /dev/sda was 100% busy.
It’s worthwhile to note that the resource that is most vulnerable to over-use is usually Disk (especially if its SATA), followed by memory, then CPU and then network.
At this stage of troubleshooting, the following points are worth noting:
- We observe the server for at least 30 secs before deciding on which resource is being hogged. The one that remains on top the most is the answer.
- While using top, we use the “i” switch to see only the active processes, and “c” switch to see the full command line.
- The “%wa” in top command helps us to see the wait average to know if its a non-CPU resource hog.
- Using pstree, we look for any suspicious processes or unusually high number of a particular service. We then compare the process listing with a similarly loaded server to do a quick check.
- We use netstat to look for any suspicious connections, or too many connections from one particular IP (or IP range).
[ Don’t wait for your server to crash! Protect your server with 24/7 monitoring & maintenance by experienced server specialists. ]
Troubleshooting is as much an exercise in invalidating possible scenarios as it is about systematically zeroing in one particular possibility.
When you know how various commands give an output in a normal stable server, you will gain an instinct of knowing what is NOT right.
2. Find the service hogging that resource
Finding the abused resource is the easy part. Once it is located, we then move on to locate which service is hogging the resource.
For that our server admins use specialist tools that’s tuned to troubleshoot that resource. In our current example, we continued using atop (as it has advanced resource listing functions).
We have already identified that mysql is the service that is automatically sorted on top of the list. Now, to get more details of disk usage we used “d” on the interactive screen.
The output looked like below:

atop output showing disk statistics
We could see that the disk operations statistics were jumping off the normal values against the mysql processes.
Don’t let server load crash your server! Get expert help now.
Alternatively, we use iotop for analyzing the disk based load. The iotop output for the same server looked like below:
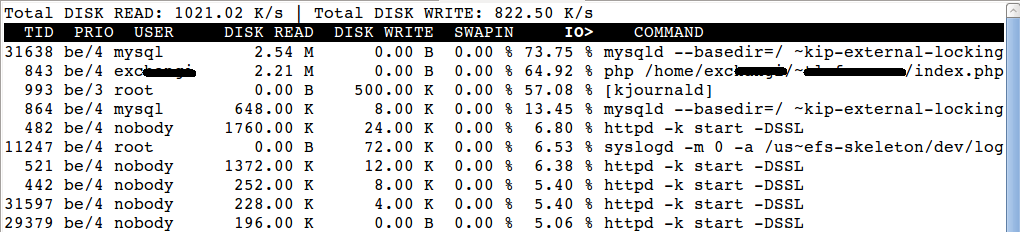
From this we confirmed without doubt that it is mysql which is hogging the disk. For checking memory we use atop, top or some clever use of ps.
To check CPU usage, the best utilities are atop and top. If you are feeling a bit adventurous, try out some bash kung-fu using ps like here:
# ps -eo pcpu,pid,user,args | sort -k 1 -r | head

%CPU   PID USER     COMMAND
 9.4 29051 mysql    /usr/sbin/mysqld --basedir=/usr --datadir=/var/lib/mysql
 8.5 28480 mysite   /usr/bin/php /home/mysite/public_html/index.php
 6.5 28493 mysite   /usr/bin/php /home/mysite/public_html/index.php
 5.0 13738 root     cxswatch - scanning
 5.0 13735 root     cxswatch - sleeping
 4.9 13737 root     cxswatch - scanning
20.7 21557 root     /bin/bash /usr/local/sbin/maldet -a /home/mydom/
 2.0 28494 root     /usr/sbin/exim -Mc 1ZaWJF-0007PK-CJ
19.2 28402 mydom    /usr/bin/php /home/mydom/public_html/index.php
For network usage analysis, the best utility is nethogs. It will allow you to map a process ID to a high network usage. Apart from atop armed with netatop module, we haven’t yet seen any other utility do that.
3. Find the virtual host over-using that service
At this point we know which service is causing the bottle-neck. But a service doesn’t act on it’s own. The load spike should be linked to a user’s request of that service.
Our expert techs use service specific tools for further troubleshooting. For mysql, we’ve found many useful tools such as mtop or mytop. In our example here, we used mtop that gave the below output:
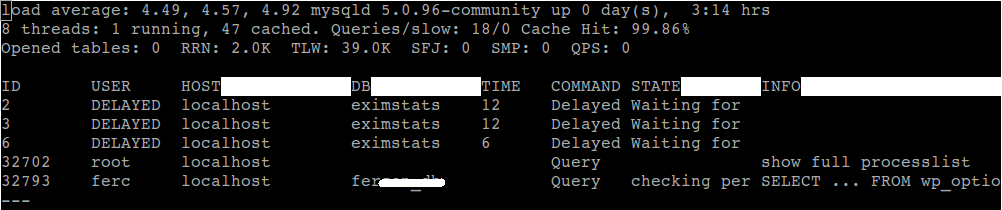
In this server, we saw that the user “ferc” was very busy in using his database. A follow-up check of his access log showed us that his comments page were getting hammered by spam bots because his captcha was broken.
Also, he had opted to not use our firewall, which made his site vulnerable to spam bots. So, it was quickly rectified by enabling mod_security protection in his site, and the load started coming down.
The other services which we’ve have noted to be taking load are backup processes, server maintenance processes like tmpwatch, update scripts, IMAP server, Apache and sometimes SMTP server due to inbound spamming.
The best place to start service specific troubleshooting is to look at their individual access logs. We increase log verbosity, we’ve often found the users taxing that particular service.
When we see that it is not an internal maintenance process that is inducing the load, we use tshark or tcpdump to log which virtual host is getting all the connection requests on the port of that particular service.
Too much access to service ports can denote an attack or peak traffic, based on which we further take corrective actions such as blocking IP in firewalls or limiting resources per account.
[ A slow server will drive your customers away. Save your business now! Our server specialists will keep your servers fast, secure and rock solid. ]
Take-away from this post
Bobcares support techs rely on a systematic troubleshooting approach as much as we focus on the right tools for the job. Today, we’ve seen by example how we go about fixing a high load average issue. The take-aways are:
- It is important to be disciplined in the approach to troubleshooting. By following this three step process, we are able to walk down to the specific virtual host in no time.
- In troubleshooting, knowing what is NOT causing the issue is as important as following a thread to trace what is causing it. With our habit of frequently checking all command outputs in a normal server, we are able to immediately see what is wrong.
- We use specialist tools that are best suited for each situation. Developing a curiosity to explore new and better utilities helps us stand in good stead when faced with an emergency.
Bobcares helps businesses of all sizes achieve world-class performance and uptime, using tried and tested website architectures. If you’d like to know how to make your website more reliable, we’d be happy to talk to you.

please help me, my server is having high cpu, i used pstree command, and i found this
init─┬─atd ├─auditd───{auditd} ├─clamd───{clamd} ├─crond ├─dbus-daemon ├─dovecot─┬─anvil │ └─log ├─exim ├─fail2ban-server───8*[{fail2ban-serve}] ├─httpd───18*[httpd] ├─mdadm ├─6*[mingetty] ├─mysqld_safe───mysqld───23*[{mysqld}] ├─nginx───5*[nginx] ├─rsyslogd───3*[{rsyslogd}] ├─spamd───2*[spamd] ├─sshd─┬─sshd───bash───pstree │ └─sshd───bash ├─udevd───2*[udevd] ├─vesta-nginx───vesta-nginx ├─vesta-php───2*[vesta-php] └─vsftpd
Hi Jedi,
From the pstree results, I suspect MySQL processes to be the reason for high CPU in your server. Please contact our expert server administrators at https://bobcares.com/emergency-server-support/ if the issue persists. We’ll inspect your server in detail to pinpoint the exact cause and fix the high CPU issue in no time.
please give me some tips to fix this please, i am short of cash now
Hi Jedi,
As I’ve mentioned in the article, you need to start with finding which resource is being over used.
Use the utility atop and run it for a few minutes to see which resource is highlighted in red (see image in the article).
Then use more specialized tools for that resource to locate which service is hogging that resource.
the atop command didnt work on my ssh, it says command not found
Hi Jedi,
You need to first install the ‘atop’ utility in your server, before you can use it.
To install atop on RHEL/CentOS/Fedora Linux, use
yum install atop
To install atop on Debian/Ubuntu Linux, use
apt-get install atop
also i noticed when i stop mysql, the cpu reduces drastically,
[mysqld]
datadir=/var/lib/mysql
socket=/var/lib/mysql/mysql.sock
symbolic-links=0
skip-external-locking
key_buffer_size = 256M
max_allowed_packet = 32M
table_open_cache = 256
sort_buffer_size = 1M
read_buffer_size = 1M
read_rnd_buffer_size = 4M
myisam_sort_buffer_size = 64M
thread_cache_size = 8
query_cache_size= 16M
thread_concurrency = 8
#innodb_use_native_aio = 0
innodb_file_per_table
max_connections=200
max_user_connections=50
wait_timeout=10
interactive_timeout=50
long_query_time=5
#slow_query_log=1
#slow_query_log_file=/var/log/mysql-slow-queries.log
[mysqld_safe]
log-error=/var/log/mysqld.log
pid-file=/var/run/mysqld/mysqld.pid
#
# include all files from the config directory
#
!includedir /etc/my.cnf.d
this is my current
Hi Jedii,
As mentioned in my previous comment, MySQL seems to be the issue. Please check the ‘process list’ of MySQL to identify which database and query is causing the high load.
Very nice article. Good example of practical troubleshooting. Would appreciate if you put more such insightful articles of sysadmin experiences.
One of the best and my favorite tech blog ever.The blog suggestion are very insightful. Here’s one more useful tech article that I found interesting is www(dot)troubleshootxperts
(dot)com/install-and-activate-yupp-tv-on-roku/