


Let’s explore how OpenSearch uses memory, the common causes of memory alerts, practical troubleshooting steps, and long-term strategies for maintaining a healthy cluster.
Understanding OpenSearch Memory Architecture
OpenSearch runs on the Java Virtual Machine (JVM) and is built on Apache Lucene. Its memory usage is divided into two primary categories.
JVM Heap Memory
The JVM heap is used for:
- Query execution
- Aggregations
- Fielddata
- Query and request caches
- Cluster metadata
Off-Heap and Operating System Memory
Off-heap memory supports:
- Lucene segment files
- File system cache
- Network buffers
- Memory-mapped files
A stable OpenSearch deployment depends on maintaining the right balance between JVM heap and operating system memory. Allocating too little memory to either can affect overall performance.
Best practices:
- Allocate 50% of total system RAM to the JVM heap.
- Keep the heap size below 32 GB to preserve compressed object pointers.
Common Causes of Memory Alerts
Several factors can increase memory usage and trigger alerts.
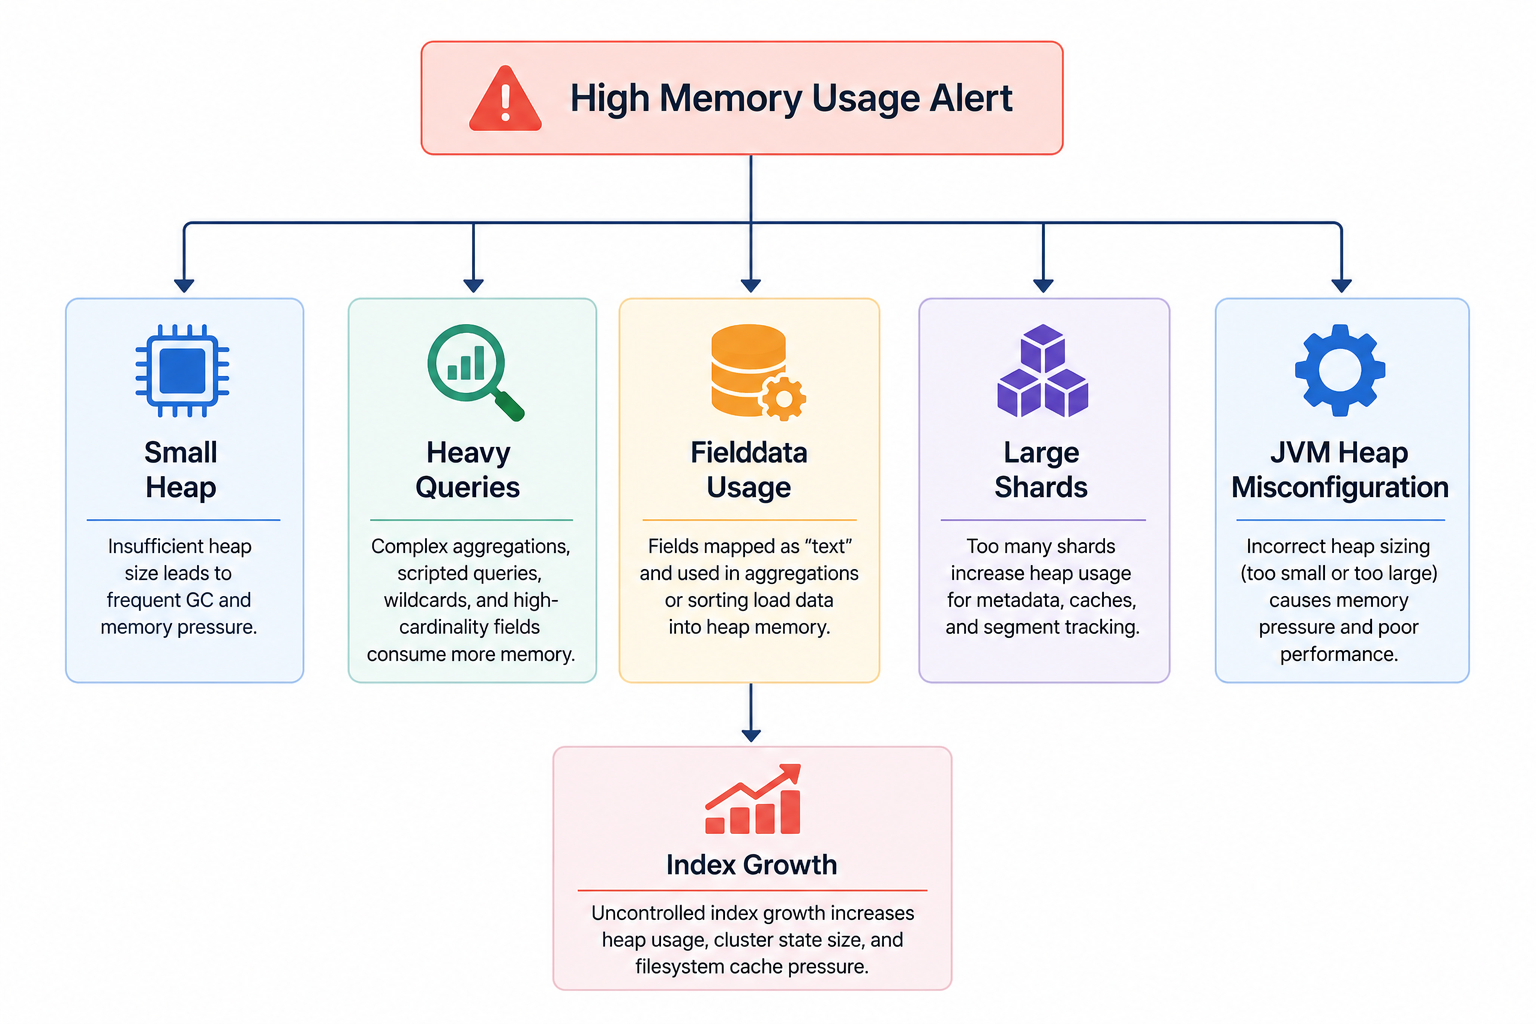
1. Incorrect JVM Heap Size
An underallocated heap leads to frequent garbage collection and increased memory pressure. On the other hand, allocating too much memory to the JVM reduces the operating system’s file cache, slowing search operations.
Recommended sizing:
- System RAM: 16 GB
- JVM Heap: 8 GB
2. Heavy Aggregations and Expensive Queries
Some query types require significant heap memory during execution.
Examples include:
- Large terms aggregations
- Nested aggregations
- Script-based queries
- Wildcard and regex searches
- High-cardinality fields
3. Excessive Fielddata Usage
Fielddata is one of the most common sources of high heap memory consumption.
A typical cause is mapping fields as text instead of keyword while using them for sorting or aggregations.
Having trouble with OpenSearch memory?

4. Oversharding
Every shard consumes heap memory for metadata, caches, and segment tracking.
As a general guideline, keep shard density below 20 to 25 shards per GB of heap memory. Excessive numbers of small shards increase memory usage and reduce cluster efficiency.
5. Uncontrolled Index Growth
Old indices that remain in the cluster continue consuming resources.
This increases:
- Heap usage
- Cluster state size
- File system cache pressure
Investigating Memory Alerts
A structured investigation helps identify the underlying cause.
Step 1: Check JVM Heap Usage
Retrieve JVM statistics.
GET _nodes/stats/jvm
Review these metrics:
heap_used_percentgc.collectors.old.collection_time_in_millisgc.collectors.young.collection_count
Step 2: Identify Fielddata Usage
Retrieve fielddata statistics.
GET _nodes/stats/indices/fielddata
Look for:
- Fields consuming large amounts of heap memory
- Continuous fielddata growth
Step 3: Check Circuit Breakers
Review circuit breaker statistics.
GET _nodes/stats/breaker
Circuit breakers approaching their limits often indicate excessive heap usage during query execution.
Step 4: Review Shard Distribution
Check shard allocation across the cluster.
GET _cat/shards?v
Verify:
- Nodes with high shard counts
- Uneven shard distribution
Step 5: Identify Large Indices
Review index sizes.
GET _cat/indices?v&s=store.size:desc
Large indices can contribute significantly to memory usage and should be reviewed as part of the investigation.
Immediate Mitigation Steps
Once the cause has been identified, several actions can reduce memory pressure.
Clear the Fielddata Cache
Use the following command to clear the fielddata cache temporarily.
POST _cache/clear?fielddata=true
This provides short-term relief but does not address the underlying issue.
Reduce Query Load
Consider the following actions:
- Limit aggregation sizes
- Avoid wildcard searches
- Add query timeouts
- Restrict expensive queries in user-facing applications
Scale Resources
Additional infrastructure may be required in some environments.
Possible options include:
- Increase system RAM
- Increase JVM heap size
- Add additional data nodes
- Separate master and data nodes
Long-Term Best Practices
Preventing recurring memory issues requires improvements across indexing, cluster design, and monitoring.
Improve Index Mappings
Recommended practices include:
- Use keyword fields for aggregations and sorting.
- Disable fielddata on text fields.
- Avoid dynamic mappings in production environments.
Review Shard Strategy
Memory usage can also be reduced by improving shard allocation.
Recommended actions:
- Avoid daily indices for low-volume data.
- Merge smaller indices.
- Reindex using fewer primary shards.
Implement Index Lifecycle Management
Index Lifecycle Management (ILM) automates:
- Index rollover
- Retention policies
- Deletion of old data
A typical lifecycle follows:
Hot → Warm → Delete
Monitor Proactively
Regular monitoring helps detect issues before they affect cluster stability.
Track:
- JVM heap usage above 75%
- Garbage collection time
- Fielddata growth trends
- Query latency spikes
Production Troubleshooting Checklist
Use the following checklist whenever a memory alert occurs.
- Verify the JVM heap follows the 50% RAM guideline.
- Check heap usage and garbage collection metrics.
- Identify fields consuming the most fielddata.
- Review recent query changes or deployments.
- Validate shard counts on each node.
- Confirm Index Lifecycle Management policies are active.
- Review monitoring trends for recurring patterns.
Conclusion
Memory alerts in OpenSearch often indicate underlying configuration, indexing, or query-related issues rather than isolated events. Clearing caches or restarting nodes may reduce pressure temporarily, but long-term stability depends on identifying and resolving the root cause. Additionally, maintaining appropriate heap sizing, efficient index mappings, balanced shard counts, and proactive monitoring helps improve cluster reliability under production workloads. Bobcares helps businesses manage and troubleshoot OpenSearch environments through performance tuning, infrastructure management, and proactive monitoring. Our engineers assist with memory analysis, cluster optimization, and ongoing operational support to maintain stable and reliable search platforms.

