


Improve AWS monitoring with cost optimization & monitoring. Track cloud performance, set alerts, and detect issues early for better efficiency.
Manually monitoring AWS environments becomes a burden as environments grow, and manually checking servers, resource usage, log files, as well as tracking data that services such as EC2, RDS, Lambda, and Load Balancers generate, is an additional burden.
AWS CloudWatch takes away the burden of manually monitoring AWS resources, logging, and dashboard creation. It also takes away the burden of event response. It helps teams find issues and improves performance.
An Overview
What Is AWS CloudWatch?
AWS CloudWatch is a service that collects logs, metrics, and events, and provides observability and monitoring across AWS resources and applications. It even provides monitoring across on-premises environments.
CloudWatch users can:
- Monitor AWS resources
- Collect and review logs
- Create dashboards
- Set alarms and notifications
- Automate responses to events
- Find performance issues
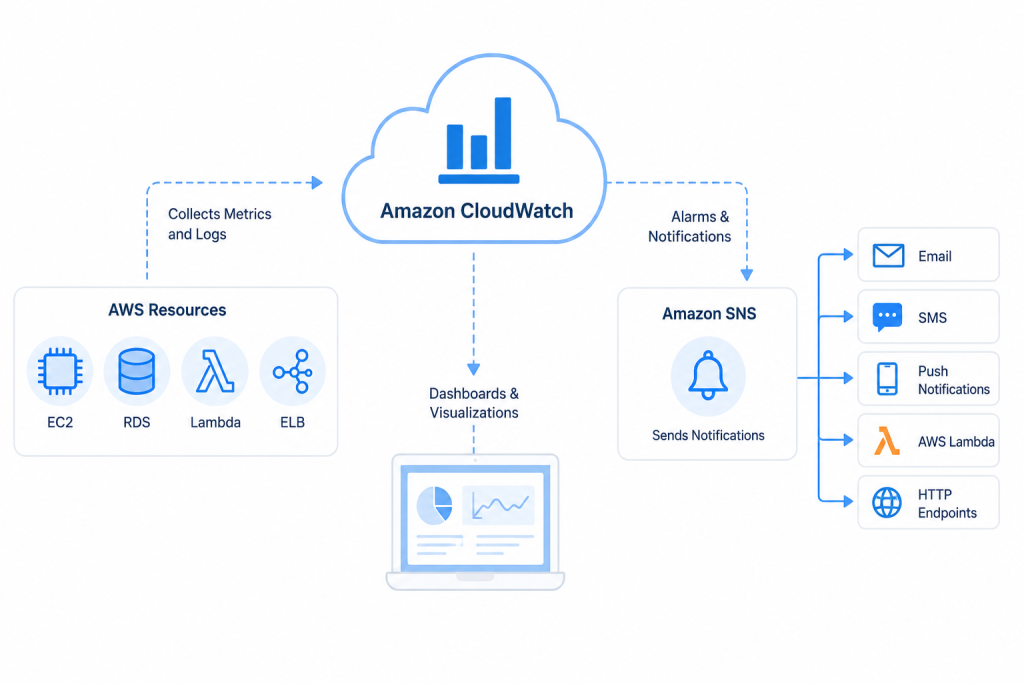
Key Features of AWS CloudWatch
Metrics
Metrics provide data about resource use and performance.
| Service | Example Metrics |
|---|---|
| EC2 | CPU Utilization, Network In/Out, Disk Read/Write |
| RDS | CPU Usage, Free Storage Space, Database Connections |
| ELB | Request Count, Latency, HTTP Error Rates |
| Lambda | Invocations, Duration, Errors, Throttles |
| EBS | Read/Write Operations, Burst Balance |
CloudWatch automatically collects many standard metrics from AWS services.
Logs
CloudWatch Logs manages and stores logs. Users of the service can perform log searches, review errors, create metric filters, and set log alerts based on specific patterns.
Examples of log usage include searching for failed login attempts, errors within the application, and errors from API calls.
Dashboards
CloudWatch dashboards provide a performance view of a system. A dashboard can represent CPU usage, provide the performance of a database, and show the current traffic, as well as the error rate and the latency of an application.
Events and EventBridge
CloudWatch Events is now under Amazon EventBridge. It supports event-based actions that users can configure to respond to an AWS event, such as invoking a Lambda function or starting a workflow.
How CloudWatch Alarms Work
CloudWatch Alarms check for defined conditions and evaluate metrics. If a condition is satisfied, CloudWatch issues an alarm, which changes its state to ALARM and executes the action. An example of a CloudWatch Alarm for EC2 is as follows:
- Metric: CPUUtilization
- Threshold: Greater than 80%
- Evaluation Period: 5 minutes
- Action: Send a notification through SNS
CloudWatch and SNS
Amazon SNS can be configured to receive CloudWatch alarm notifications through various supported channels, including:
- Email
- SMS
- Mobile push notifications
- Lambda
- HTTP endpoints
The process is simple: CloudWatch identifies anomalies, a state transition occurs on the alarm, and SNS sends the message to the configured destination.
Monitoring Logs with Metric Filters
Metric filters turn specific log patterns into metrics.
For example, if application logs contain:
ERROR: Database connection failed
A metric filter can count how often the error appears. Teams can then use that metric to trigger an alarm when the error count becomes too high.
This helps teams find repeated application problems before they affect users.
CloudWatch Agent and Logs Insights
Additional information includes:
- Memory utilization
- Disk usage
- Swap utilization
- Process monitoring
- Custom application metrics
On Linux, administrators can install the agent with:
sudo yum install amazon-cloudwatch-agent
They can then configure and start it with:
sudo /opt/aws/amazon-cloudwatch-agent/bin/amazon-cloudwatch-agent-config-wizard
sudo systemctl start amazon-cloudwatch-agent
CloudWatch Logs Insights also helps teams search and analyze log data. For example:
fields @timestamp, @message

| filter @message like /ERROR/

| sort @timestamp desc

| limit 20
This query displays recent log messages that contain ERROR.
Application-Level Monitoring with CloudWatch
Infrastructure metrics alone do not always show how an application is performing. A server may have normal CPU and memory usage while users experience high latency, failed requests, or unavailable services.
CloudWatch Application Signals provides an application-centric view of service health. It can track metrics such as latency, faults, errors, and availability, while also showing relationships between applications and their dependencies. Teams can use this information to identify which service is affected and investigate the source of a performance problem.
CloudWatch also supports service level objectives (SLOs), allowing teams to monitor application performance against defined reliability targets. This helps shift monitoring from individual AWS resources to the health and performance of the applications running on them.
Common CloudWatch Uses
CloudWatch supports several monitoring needs:
| Monitoring Area | What to Track |
|---|---|
| Infrastructure | CPU, memory, disk, network traffic |
| Applications | Response times, errors, requests |
| Security | Access attempts, IAM changes, root activity, API calls |
| Cost | Resource usage, idle resources, usage spikes |
AWS CloudWatch Best Practices
To get better results from CloudWatch:
1. Maintain critical metrics
Don’t monitor everything just to set alerts. Instead, monitor application latency, CPU usage, errors, and database availability.
2. Set applicable conditions
Normal workload behavior should dictate the conditions you use to set thresholds. For example, a CPU spike is less valuable than a sustained 80% CPU.
3. Adjust monitor intervals as needed
Basic monitoring of EC2 uses a 5-minute interval, and detailed monitoring uses a 1-minute interval.
4. Set log retention periods
Set retention periods based on log value and don’t keep logs longer than necessary. For example, retain logs for 30 days for dev and 90 days for prod.
5. Create focused dashboards
Include only what’s necessary for the dashboard. Be sure to include metrics supplied by the infrastructure and application, and some security related metrics.
6. Use composite alarms
Activate more than one alarm when more than one should contribute to the alert.
7. Automate suitable responses
Use Lambda, Systems Manager Automation, and EventBridge to automate tasks such as restarting services, scaling infrastructure, or starting response workflows.
Conclusion
AWS CloudWatch makes it easy for teams to monitor the metrics, logs, and status of their applications and resources within AWS. By detecting and responding to issues in an increasingly efficient manner, its services and features include metrics, logs, dashboards, alarms, and event-based actions.
With an emphasis on monitoring important metrics, establishing informative alarms, managing logs, and responding to issues in an automated fashion, monitoring operational concerns is highly efficient.

