


Please Note: This article is part of our historical archive. Because it was published a while ago, some of the information, links, or context may now be outdated.
It’s really annoying, when the server slows down without any apparent reason.
Often MongoDB high CPU usage can be a reason for slowness. And, this slowness can be due to bad MongoDB server optimization.
That’s why we often get requests from our customers to fix MongoDB high CPU usage as part of our Server Management Services.
Today, we’ll see how our Support Engineers fixed MongoDB high CPU usage for a customer and fixed related errors.
Reasons for MongoDB high CPU usage?
In general, CPU usage indicates the overall efficiency of any server. When there is a heavy CPU usage by MongoDB, it can often result in tardy website applications.
The performance will be high when the MongoDB use less CPU. However, it will create a very slow and undesirable user experience within the online applications when MongoDB uses high CPU.
There are several reasons that slow down the MongoDB server. It includes:
1. Wrong MongoDB server settings
Often bad MongoDB server settings cause high CPU usage which reduces the server performance.
For example, we saw that one of our customers had set to log every connection made to the server in the log file. When writing every connection to the log file, it will utilize the processor for its Input/Output operations. Therefore, it used a major part of CPU resources. Furthermore, this can affect other write or read tasks in the server.
Additionally, this would make the MongoDB log file grow up to a large size. And, as MongoDB server processes these big log files, eventually all database tasks will get delayed.
2. System Parameters
From our experience in managing servers, our Dedicated Engineers often see that network stack variables and file system parameters also affect the working of MongoDB.
In addition to tweaking in MongoDB server configuration, setting the ideal values for the following system parameters also improve the MongoDB performance.
- Linux Ulimit
- Virtual Memory
- Transparent HugePages
- Block Device :
- IO Scheduler and Read-Ahead
- Filesystem and Options
- Network Stack
3. Bad database queries
Sometimes, the database takes too long to perform and finish the queries. These slow queries can occur if the database doesn’t have proper DB indexes.
DB indexes help to perform faster database queries in MongoDB. Without indexes, it uses a Collection Scan method to determine the documents that match the query statement. And, when you have a lot of documents in your collection, it can take a while to process the query.
How we fixed MongoDB high CPU usage
Till now, we saw the top reasons that would affect MongoDB performance on a server. Now, it’s time to check the solutions for the same.
Let’s have look on how our Support Engineers recently solved the CPU usage problem.
Recently, one of the customers had an issue with server performance. His WHM server was very slow and provided undesirable user experience within their website applications.
On checking, our Support Engineers found that his MongoDB used high CPU resources and that slowed his server. The exact process usage on his server appeared as below. MongoDB was using a CPU% of 138.24.

So, we took the following steps to solve the issue.
1. Initially, we connected to the server as root user.
2. We then checked the CPU usage and load on the server. The result showed 200% CPU usage and looked like:

3. On further checking the details, we found that the MongoDB log file size had reached 105GB on the server. This customer had set to log all MongoDB queries.
4. Then, after checking with the customer, we backed up the log file and cleared it and checked the CPU usage by using the command
top -c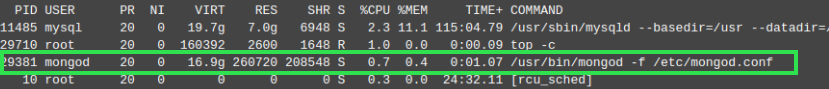
5. We checked the log file and could find that every connection made to the server was being logged in the log file. That increased the CPU usage so we suggested to the customer to logging only the error messages in the log file of the database server.
Additionally, we tweaked the system parameters on the server for the optimum MongoDB performance too.
That fixed the issue and gave optimum server performance.
[Is your MongoDB server causing high CPU usage? We’ll fix it for you.]
Conclusion
In short, often bad database queries and wrong MongoDB server settings result in MongoDB high CPU usage on the server. Today, we saw how our Support Engineers fixed high CPU usage problem for a customer.

I have a database containing 110,000 parcels. I use a geometry query in mongo that searches all geometries in a database and finds a point in polygon to return the appropriate record. The collection already has a 2D sphere index for the field containing the geometries.
When I worked with a database only containing around 10,000 parcels the search would complete in a second or less, which was acceptable. Now the the response can take 5 seconds or longer.
I experimented with moving the database to an AWS instance with 16 processors and 32 gigs of memory but the response time didn’t improve in the least.
Is there a specific way to attach improved hardware to a mongo database in order to reduce lag times?
Hello Cyrus,
Reducing lag times in MongoDB requires a detailed study by our Database Experts. We’ll be happy to talk to you on chat (click on icon at right-bottom).
my environment:
1. 1 primary + 2 secondary + 1 arbiter;
2. primary node Host 80 core cpu, 252g memory,the main node host cpu is 100%,
Hi HonboLiu,
We will need more information to help you here.
Can you click on the chat button on the right bottom, and talk to the agent?
We can get someone to look into this issue within an hour.
Thanks.
my environment:
1. 1 primary + 2 secondary + 1 arbiter; version 4.0.8
2. primary node Host 80 core cpu, 252g memory,the secondary node ,24 core ,252 cpu, all raid10 sas disk.ext4 filesystem
3. IO Scheduler and Read-Ahead have been configured according to the official website,numa disable,transparent_hugepage disable
4. datebase size 135G,Of which oplogs 80g,so the real data is only 40g
5. The number of daily connections is 3200,and there has been no business adjustment or launch recently
6. machine uptime, 1456 days
my question:
1、Suddenly the primary node, system cpu is 95%,user cpu is 5%,mongod.log shows that there are a lot of timeout operations, we verified that all are normal business operations
2. In this case, the front desk business feedback, unable to write data
3. top -Hp mongod process,140 active threads, all conn threads, no mongo system threads, about 95% of the CPU per thread
4. The database was repeatedly restarted and master-slave switchover, the failure phenomenon did not disappear. After 2 hours, for unknown reasons, the active sessions automatically dropped to about 5, the system cpu dropped below 3%, and the normal situation was restored.
I want to know what caused the massive consumption of system cpu
thanks