


Learn how Azure Monitor helps troubleshoot Windows performance using CPU, memory, disk, network, logs, KQL, Application Insights, and alerts.
A Windows server can continue to respond to requests even as it is already slowing down. You may notice that there is more CPU usage, less memory available, the storage request may be taking longer or an application service may be stopping without stopping the entire workload. Often, the problem is only found by the user and not the administrator. For organizations managing these environments, Bobcare’s Azure Managed Services can help maintain the monitoring, automation, and operational practices needed to keep infrastructure under control.
Azure Monitor can bridge the gap by collecting the telemetry, logs, and performance data of Azure resources and Windows workloads. Most importantly, it keeps track of what has been done that can be compared to the current state of a server and what it does normally.
This alters the investigation. When the administrator raises the question of “How do I get this VM to run faster?” he should instead be asking “What changed? When did it change? What is the slowest part of work?
An Overview
- What Does Azure Monitor Offer?
- Getting Windows Data Into Azure Monitor
- Use Resource Metrics to Narrow the Problem
- When the VM Looks Healthy, Check the Application
- Use Log Analytics During Larger Incidents
- Configure Alerts Around the Workload
- Use Workbooks Without Creating Noise
- Collect Data That Has an Operational Purpose
- Watch the Direction of the Workload
- Conclusion
What Does Azure Monitor Offer?
A useful monitoring setup needs more than CPU graphs.
Azure Monitor can provide visibility into infrastructure performance, Windows events, application errors, resource trends, and alerts. The environment can also be organized into dashboards and connected to automation or incident-management workflows.
The different data sources answer different questions.
A CPU metric can show that processor usage increased. Memory data can show whether available RAM is steadily declining. Disk measurements can reveal storage contention. Network statistics can expose an unexpected change in traffic. Windows Event Logs can show what was happening around the same time. Application Insights can take the investigation further when the infrastructure itself appears healthy.
That distinction matters because the visible symptom is not necessarily where the fault exists.
Getting Windows Data Into Azure Monitor
Azure Monitor Agent (AMA) is installed on the supported Windows virtual machines and performs data collection from the guest system. This can be CPU usage, memory usage, disk performance, network statistics, Windows Event Logs, performance counters and custom log files, depending on the configuration. Data Collection Rules (DCRs) regulate the data that is gathered and the configuration of the data collection.
For a small environment, manually checking individual machines may seem manageable. That approach becomes difficult as the number of servers increases. Centralized collection allows administrators to apply monitoring requirements across machines instead of maintaining every configuration separately.
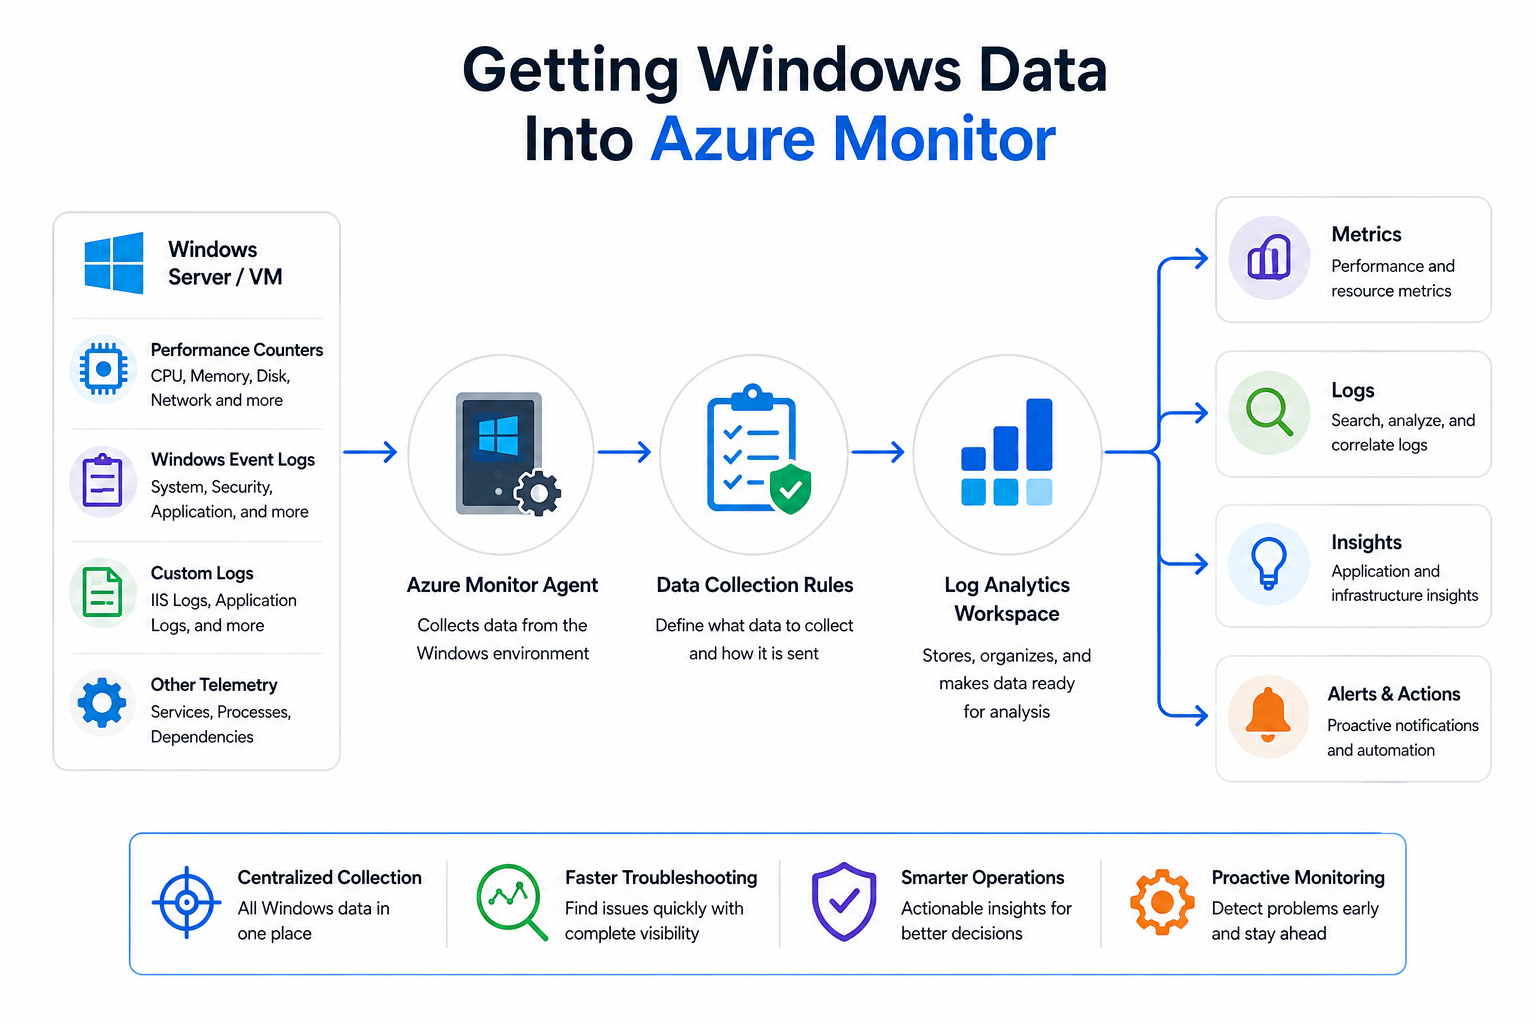
The collected data can be stored in a Log Analytics Workspace. Windows Event Logs, IIS logs, performance counters, Azure Activity Logs, security events, and application logs can all feed into the workspace.
Metrics provide the numerical side of the picture. CPU percentage, available memory, disk read and write activity, network throughput, and disk queue length can be monitored at regular intervals. Their real value comes from being able to see how those measurements change over time.
Use Resource Metrics to Narrow the Problem
Suppose users report that an application has become slow. The server shows 85% CPU utilization.
That number alone is not enough to justify resizing the VM.
A scheduled backup, antivirus scan, or other maintenance task could explain a temporary increase. Persistent high utilization is more concerning, particularly when it does not match the workload’s expected behavior. Potential causes include inefficient application code, a process stuck in a loop, heavy database queries, malware activity, or a VM that no longer has enough capacity for the workload.
The timing of the increase is useful evidence. A CPU spike that occurs every night during a scheduled job has a different meaning from a baseline that has gradually increased throughout the day over several weeks.
Memory needs the same treatment. Azure Monitor can track available memory, committed memory, page file usage, and paging activity. A gradual decline in available memory may indicate a memory leak, while heavy paging can affect application performance because Windows is relying more heavily on disk.
Storage can produce an even less obvious symptom. An application may be sluggish while CPU and memory remain within normal limits. Azure Monitor exposes read latency, write latency, IOPS, disk queue length, and throughput. High latency or a consistently growing queue can point toward storage that is struggling with demand. Backup activity and database operations are possible contributors.
Network conditions should not be overlooked either. Incoming and outgoing traffic, network errors, packet rates, and bandwidth utilization can help distinguish a server-side resource problem from an issue involving connectivity or another service. Unexpected traffic may result from increased user activity, large transfers, distributed attacks, or an application repeatedly communicating with a dependency.
The important point is to compare these signals rather than treating each metric independently.
When the VM Looks Healthy, Check the Application
Infrastructure monitoring cannot explain every application problem.
A Windows VM may have reasonable CPU, memory, disk, and network utilization while users continue to experience slow responses. Application Insights provides information closer to the request itself, including response times, failed requests, exceptions, dependency calls, user sessions, and performance bottlenecks.
This can separate an infrastructure problem from an application or dependency problem.
For example, an application may spend most of its response time waiting for SQL queries. Another request may be delayed by an external API. Increasing the VM’s CPU allocation would not address either problem.
Application telemetry therefore gives administrators another place to look when the Windows server metrics do not explain the user experience.
Use Log Analytics During Larger Incidents
Local Event Viewer is useful when troubleshooting one machine. It is much less convenient when an application spans several servers.
Log Analytics provides centralized access to collected logs, while Kusto Query Language (KQL) can be used to filter, aggregate, analyze, and visualize the data.
An administrator investigating an incident might need to find which servers generated critical errors, how many login failures occurred during a particular period, which VMs exceeded a CPU threshold, or which Windows services stopped unexpectedly.
The advantage is not simply that the query is faster than manually opening logs. It allows events from different machines to be considered together.
If several application servers begin reporting errors at approximately the same time, for example, the shared timing may be more significant than anything found on one server. A common dependency, deployment, or infrastructure event could be involved.
KQL is also useful for recurring operational checks. Queries that answer common questions can be reused rather than recreated every time an incident occurs.
Is your Windows workload slowing down?

Configure Alerts Around the Workload
A monitoring system that nobody notices is not much help during an incident.
Azure Monitor Alerts can trigger notifications when specified conditions are met. Examples include sustained CPU utilization, low available memory, a missing VM heartbeat, low disk space, an unexpectedly stopped Windows service, or application response times exceeding an acceptable threshold.
Example thresholds include CPU above 85% for more than 15 minutes, available memory below 10%, and disk space below 15%. These values should be treated as starting points rather than rules that belong on every Windows VM. The normal behavior of the workload should determine what warrants an alert.
Alert fatigue is a practical concern. If a notification fires repeatedly and rarely results in an action, administrators can begin ignoring it. That makes it easier for a genuinely important alert to be missed.
Alert rules should therefore be reviewed when workloads change. The threshold that made sense for an application six months ago may no longer represent a useful signal.
Use Workbooks Without Creating Noise
Workbooks can combine charts, tables, KQL queries, and visualizations into a single interactive view. A Windows Server workbook might include CPU trends, memory consumption, disk latency, failed login attempts, and event information.
The dashboard should serve the people using it.
Infrastructure teams may need resource and capacity information. Security teams may need authentication and audit events. Application teams may care more about request duration, exceptions, and dependency performance.
Putting every available metric on one screen does not necessarily improve visibility. It can make an incident harder to investigate because the useful signal is surrounded by information that is irrelevant to the task at hand.
Resource organization helps keep these views manageable. Consistent naming, resource groups, and tags make dashboards and alerts easier to maintain as the environment expands.
Collect Data That Has an Operational Purpose
There is a cost to collecting telemetry, and more data does not automatically produce better troubleshooting.
Logs and metrics should be selected according to what the team needs to monitor, investigate, and retain. Collecting every available option can increase storage requirements while adding noise to investigations.
The monitoring design should therefore begin with operational requirements.
If Windows service failures need to be investigated, the relevant event information must be available. If application latency is the concern, request and dependency telemetry becomes important. If capacity planning matters, the organization needs enough historical resource data to identify changes in workload behavior.
Metrics and logs are particularly useful together. Metrics show the condition and its timing. Logs can provide events that help explain what was happening during that period.
\[newsletter\_form form=”1″]
Watch the Direction of the Workload
Current utilization can be misleading without historical context.
A server running at 70% CPU may be operating normally. If it has remained around that level for months, there may be little reason to intervene. If it has climbed from 40% to 70% during the past month, the same number tells a different story.
The workload is moving toward a higher level of resource consumption.
That pattern is useful for capacity planning. Administrators can investigate the reason for the increase, determine whether application optimization is possible, and decide whether additional capacity will eventually be required.
The same principle applies to memory, disk, and network usage. A gradual change gives the operations team more time to act than a sudden resource exhaustion event.
Conclusion
Azure Monitor is most valuable when it is used to investigate how a Windows workload behaves, rather than simply to display server statistics.
Azure Monitor Agent collects the Windows data. Metrics show resource behavior. Log Analytics and KQL provide a way to examine events across machines. Application Insights adds application and dependency information when infrastructure metrics are not enough. Alerts can bring attention to defined conditions, while Workbooks organize the information needed by different teams.
The investigation becomes stronger when these sources are considered together.
A sustained CPU increase may lead to a process-level investigation. A falling memory baseline may indicate a leak. High disk latency can explain slow applications that have plenty of CPU available. Application telemetry may show that the VM is healthy but waiting on a database or external service.
Historical monitoring adds another layer. It allows administrators to see whether a problem is an isolated event or part of a longer change in workload behavior.
That is the practical value of Azure Monitor for Windows environments: not simply knowing that something is wrong, but having enough evidence to determine where to look next and address the problem before it becomes a larger operational incident.

