A server environment can appear healthy while a service is unavailable. CPU utilization may look normal, yet users could still experience website delays caused by database performance, disk I/O, DNS issues, or network congestion.
Infrastructure monitoring helps administrators see what is happening across an IT environment. In 2027, monitoring needs to cover operating systems, virtual machines, network devices, cloud resources, application services, and storage, along with alerts that highlight potential issues.
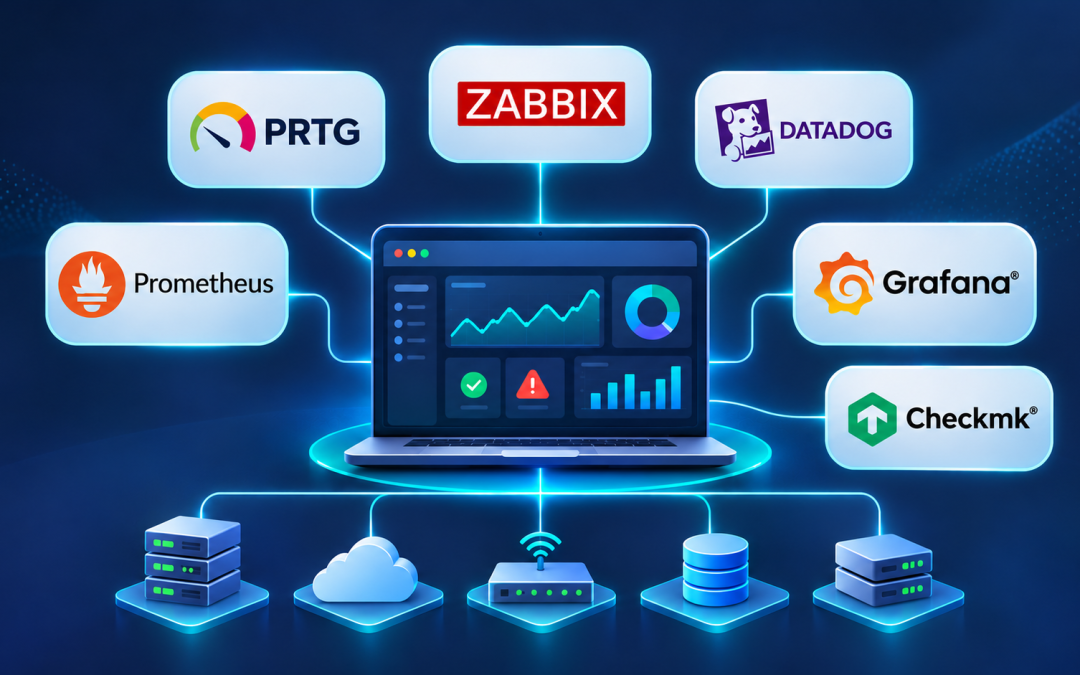
Several tools can provide this visibility, including PRTG Network Monitor, Zabbix, Datadog, Prometheus with Grafana, and Checkmk.
Infrastructure monitoring becomes more useful when you consistently monitor server health, performance, and critical services. Our Server Management services provide continuous server monitoring and help identify performance, availability, security, and critical service issues before they cause prolonged disruptions.
What Is Infrastructure Monitoring?
Infrastructure monitoring is the continuous collection and analysis of information across an IT environment to provide visibility into performance and availability.
A monitoring platform typically provides visibility into:
- Server Performance: CPU, memory, disk usage, disk latency, and operating system status.
- Network Performance: Bandwidth, packet loss, latency, interface errors, and device availability.
- Application Services: Web servers, database connectivity, and HTTP response codes.
- Virtualization and Cloud: Virtual machines, containers, cloud instances, and resource usage.
- Storage: Free space, read/write speed, and disk health where applicable.
- Alerts and Events: Thresholds, service failures, unexpected changes, and recurring issues.
This information helps administrators determine whether a system is completely unavailable or experiencing a performance problem.
Consider a hosted website that slows down while CPU utilization remains normal. CPU data alone may not reveal the cause. Memory pressure, database response times, disk latency, and network traffic can provide more useful information when investigating the issue.
The Best Infrastructure Monitoring Tools in 2026
The following tools are worth considering, depending on your infrastructure and monitoring needs.
1. PRTG Network Monitor
PRTG Network Monitor is an infrastructure monitoring tool designed to monitor servers, network devices, and critical services.
PRTG uses a sensor-based approach. This allows administrators to monitor specific metrics such as CPU load, network traffic, disk usage, and service availability. Depending on the device, PRTG can collect data through technologies such as SNMP and WMI.
Key Features
- Centralized dashboards
- Network device discovery
- Threshold alerts
- Bandwidth and interface monitoring
- Windows and other system monitoring
- Historical data
Best Used For
PRTG is well-suited for hosting providers, Windows-based IT environments, and infrastructures with multiple servers and network devices. Its dashboards can help administrators identify resource pressure and service outages.
Limitations
PRTG uses sensor-based licensing, so monitoring requirements need careful planning. A single device may require multiple sensors depending on what needs to be monitored.
The required monitoring methods should also be checked against the operating systems and applications in the environment.
PRTG can be a practical choice when server and network monitoring are the primary requirements.
2. Zabbix
Zabbix is an open-source monitoring platform that collects performance and availability data from servers, networks, applications, and other infrastructure components.
Monitoring can use agent-based or agentless methods. Templates can also be used to configure monitoring across different systems.
Key Features
- Server, network, and application monitoring
- Agent-based data collection and supported agentless checks
- Custom triggers, dashboards, and notification rules
- Data collection and trending
- Templates
- Self-hosted deployment
Best Used For
Zabbix is a suitable option when organizations want more control over their monitoring environment without paying host-based licensing costs. It can be used in hosting environments, internal IT environments, and mixed Windows and Linux infrastructures.
Limitations
Zabbix requires planning as an environment grows. Polling intervals, data storage, templates, and trigger conditions need careful management.
The platform can provide broad monitoring without a license cost, but it still requires time to configure and maintain.
3. Datadog
Datadog provides a managed observability platform for infrastructure monitoring. It offers visibility into infrastructure metrics, logs, and application performance.
This can help administrators understand activity across virtual machines, containers, cloud resources, databases, and distributed applications. Related metrics and events can also be viewed together.
Key Features
- Infrastructure metrics and host monitoring
- Cloud and container integration
- Dashboards, alerts, and anomaly detection
- Logs and application performance
Best Used For
Datadog can be a good fit for DevOps teams, cloud engineering teams, and complex applications that require a broader view of infrastructure and application activity.
Limitations
Costs can increase as the number of hosts, data ingestion, log volumes, and additional features increase. The expected cost should therefore be estimated before deployment.
Datadog is worth considering when a unified view of infrastructure and applications is required.
4. Prometheus and Grafana
Prometheus and Grafana are commonly used together as part of a monitoring stack.
Prometheus provides metrics gathering, storage, and rule-based alerts, while Grafana provides dashboards. Exporters can expose metrics from systems that do not provide Prometheus metrics directly.
Key Features
- Metrics gathering and querying
- Rule-based alerts
- Flexible dashboards
- Kubernetes and instrumented application support
- Large selection of exporters
Best Used For
Prometheus and Grafana are well suited to environments involving Kubernetes clusters, microservices, container-based applications, and custom metrics.
Limitations
Prometheus and Grafana do not represent a complete infrastructure monitoring solution on their own. The monitoring stack may require configuration for exporters, metric labels, alerts, long-term retention, and permissions.
Additional components may also be needed for centralized logs, traces, and long-term storage.
This combination provides significant flexibility when an organization has the knowledge required to build and manage its own observability stack.
5. Checkmk
Checkmk provides infrastructure discovery and monitoring for servers, network devices, and services. Different editions are available, making the available features dependent on the selected edition.
The platform can be useful in environments containing a mix of on-premises systems, virtual machines, and cloud resources.
Key Features
- Automated discovery
- Server and network monitoring
- Checks and alerts
- Centralized infrastructure dashboards
- Hybrid monitoring support
Best Used For
Checkmk is worth considering when broad monitoring coverage is required and reducing manual configuration is important.
Limitations
Available features vary by edition and deployment approach. Organizations should verify that their infrastructure can integrate with the platform, along with licensing requirements and the checks available for their devices.
Infrastructure Monitoring Tools Comparison
| Tool | Best Used For | Key Benefit | Key Consideration |
|---|---|---|---|
| PRTG Network Monitor | Traditional IT and hosting | Simple server and network monitoring | Sensor-based licensing |
| Zabbix | Self-hosted environments | Flexible monitoring | Setup and management requirements |
| Datadog | Cloud-native environments | Unified infrastructure and application observability | Usage-based cost |
| Prometheus + Grafana | DevOps and Kubernetes | Custom metrics and dashboards | Requires a suitable monitoring stack |
| Checkmk | Hybrid IT | Discovery and a wide range of checks | Features vary by edition |
Key Features to Consider
Choosing a monitoring tool should involve more than comparing dashboards. The infrastructure’s technical requirements should guide the decision.
1. Real-Time and Historical Data
A monitoring tool should collect data regularly enough to identify issues and retain historical information that shows how systems have performed over time.
For example, a disk that is 85% full may not require immediate action on its own. A trend showing that available space has been declining steadily over several days can indicate that a capacity issue may be approaching.
2. Alerting
Alerts need to be actionable rather than simply generating large volumes of notifications.
Common alerts include:
- CPU utilization exceeding a defined threshold
- Low disk space
- Frequent HTTP 5xx errors from a website
- An important Windows service stopping unexpectedly
Monitoring can also use warning and critical alert levels, evaluation periods, recovery notifications, and escalation rules.
A short CPU spike should not automatically be treated as a resource shortage. Alert conditions should consider the duration of the event and other relevant metrics.
3. Multi-System Support
Many organizations operate a mixture of Windows and Linux servers, network devices, virtual machines, and cloud services.
The selected monitoring platform should support the required systems through appropriate agents, protocols, APIs, and integrations.
Hosting environments may need monitoring for IIS, Apache, Nginx, SQL Server, MySQL, DNS, mail services, and control panel services.
4. Historical Reporting and Capacity Planning
Monitoring should provide enough historical information to answer questions about system behavior.
Trends in memory pressure, storage growth, traffic spikes, and resource usage can help identify capacity requirements and determine when a server may need additional resources.
5. Scalability
The monitoring platform should handle the expected number of devices, metrics, checks, and retention requirements.
The monitoring system itself consumes CPU, memory, storage, and network resources. Excessively frequent polling across many metrics can create unnecessary overhead.
Expected metric volumes and retention periods should be calculated before deployment and tested against a realistic workload.
6. Security
Monitoring systems can contain sensitive infrastructure information, including service names, internal addresses, infrastructure details, and system events.
Access should therefore be controlled through role-based access, secure communication, appropriate credentials, and restricted permissions.
Monitoring agents and integrations should only have the permissions required for their specific functions.
How to Choose the Right Infrastructure Monitoring Tool
The selection process should start with the infrastructure problem that needs to be addressed.
Windows Hosting
PRTG, Checkmk, and Zabbix can be considered for Windows hosting environments.
The selected tool should support Windows Performance Counters, IIS, SQL Server, service checks, disk space monitoring, and network monitoring as required.
Mixed Windows and Linux Environments
Zabbix and Checkmk can be considered for centralized monitoring across mixed Windows and Linux environments.
PRTG can also be considered when it fits the monitoring requirements.
Kubernetes and Distributed Applications
Prometheus with Grafana and Datadog can be considered for Kubernetes and distributed applications.
Important areas to evaluate include metrics gathering, service discovery, instrumentation, logs, traces, and overall complexity.
Limited Software Budget
Zabbix and the open-source Prometheus can be considered when the software budget is limited.
The evaluation should still account for infrastructure hosting costs, implementation time, management requirements, storage, and available technical knowledge.
Enterprise Observability
Datadog can be considered when enterprise observability is the primary requirement.
Checkmk and other infrastructure monitoring tools can also be evaluated when the primary need is infrastructure monitoring.
Example: Monitoring a Web Hosting Server
Consider a hosting server running IIS, SQL Server, and multiple websites.
Basic monitoring should cover:
- Check whether the server is available and critical services are running.
- Monitor long-term usage and recurring spikes.
- Monitor available memory, page file usage, and memory pressure.
- Alert before system or database volumes run out of space.
- Monitor latency and I/O when applications become slow.
- Monitor service availability and relevant database metrics.
- Check HTTP responses to confirm that customer-facing websites return the expected responses.
- Monitor interface utilization, errors, and packet loss where available.
- Confirm that alerts reach the appropriate administrators.
Suppose a website becomes slow while the server remains available. Monitoring may show normal CPU utilization alongside increasing disk latency and SQL Server activity. This provides useful evidence for investigating the storage and database rather than focusing only on CPU resources.
A well-designed monitoring solution can therefore provide evidence about what is causing a performance problem instead of simply showing that the server is still online.
Common Infrastructure Monitoring Mistakes
Even an advanced monitoring platform can fail to provide useful results when it is poorly configured.
1. Only Monitoring Uptime
A website or database can respond to a ping while the service isn’t functioning correctly.
Host checks should therefore be combined with appropriate service checks.
2. Using Poorly Defined Thresholds
CPU thresholds can be useful, but you should also consider the event duration, workload, and other metrics.
Thresholds should reflect how the service actually operates.
3. Ignoring Storage Growth
Looking only at current disk space can hide a developing capacity problem.
Historical trends provide more time to respond before storage becomes a critical issue.
4. Creating Too Many Alerts
Too many alerts can lead to alert fatigue.
Meaningful thresholds, de-duplication, and severity-based alerts can help keep notifications useful.
5. Not Testing Alerts
An alert that does not reach the intended recipient is not useful.
Alert delivery should be tested regularly to confirm that notifications are working as expected.
6. Failing to Maintain the Monitoring System
Monitoring software, agents, credentials, integrations, and retention settings require regular review.
The monitoring server itself should also be monitored to ensure that the monitoring system remains available.
Conclusion
The best infrastructure monitoring tool provides reliable visibility into the systems that matter, identifies real issues, and fits available resources.
The final choice should be based on actual monitoring requirements rather than the number of features a product offers. A proof of concept using realistic production workloads can help validate metric accuracy, alert delivery, integrations, retention, scalability, and overall cost before you decide.
Consistent infrastructure monitoring helps administrators identify performance and availability issues before they become bigger problems. Our Server Management services include continuous server monitoring, helping businesses keep track of server health, critical services, performance, and security.