


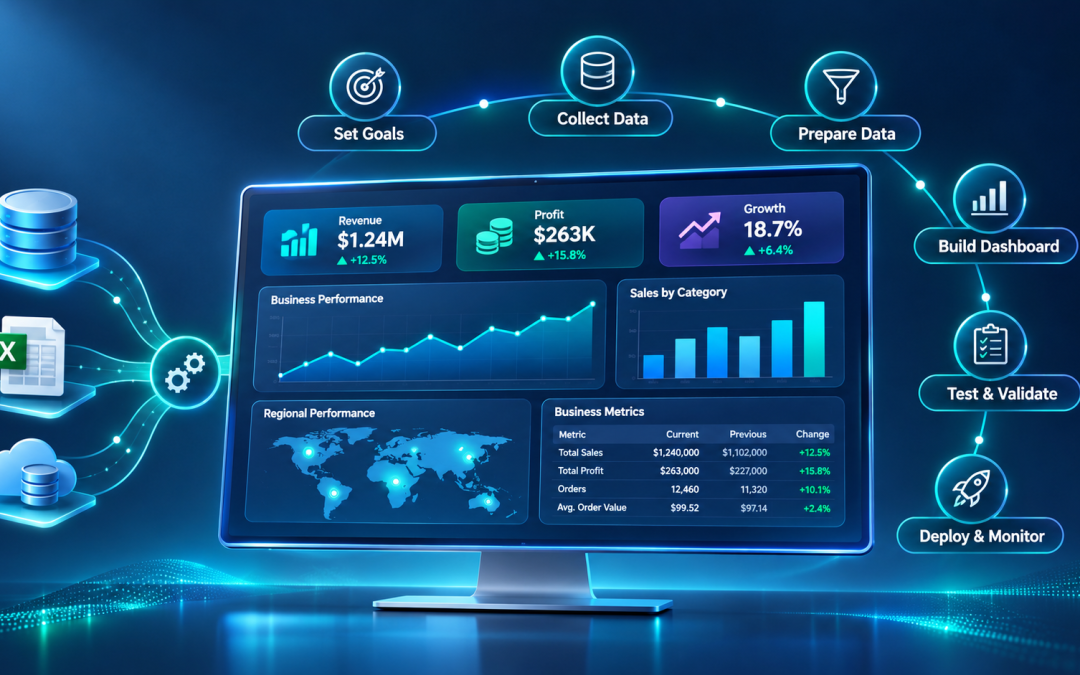
Businesses collect large amounts of data from sales platforms, customer relationship management (CRM) systems, financial applications, and other sources. However, having access to data does not automatically lead to better business decisions. The information needs to be organized and presented in a way that helps people understand business performance.
A Business Intelligence (BI) dashboard makes this possible. It brings important business metrics into one visual interface, allowing users to monitor performance, identify trends, and investigate areas that need attention.
Building a useful BI dashboard requires more than adding charts to a screen. You need to understand the business objectives, identify the right metrics, prepare the data, and design an interface that users can understand. Organizations can use our Business Intelligence Services to develop data-driven solutions that bring business information together and make performance insights easier to access and interpret.
What Is a BI Dashboard?
A Business Intelligence dashboard is a visual interface that presents key business information in one place. It uses charts, graphs, tables, and Key Performance Indicator (KPI) cards to help users understand business performance.
A BI dashboard collects information from different data sources and presents it in an accessible format. Users can monitor metrics, compare performance across periods, and explore specific areas through interactive features such as filters and drill-downs. Unlike a static report, an interactive BI dashboard allows users to explore the information and view different levels of detail. Many BI platforms also support scheduled data refreshes, helping users access updated information without manually preparing reports.
Building a BI dashboard involves several stages, from understanding user requirements to validating the finished product. The following six steps provide a practical approach.
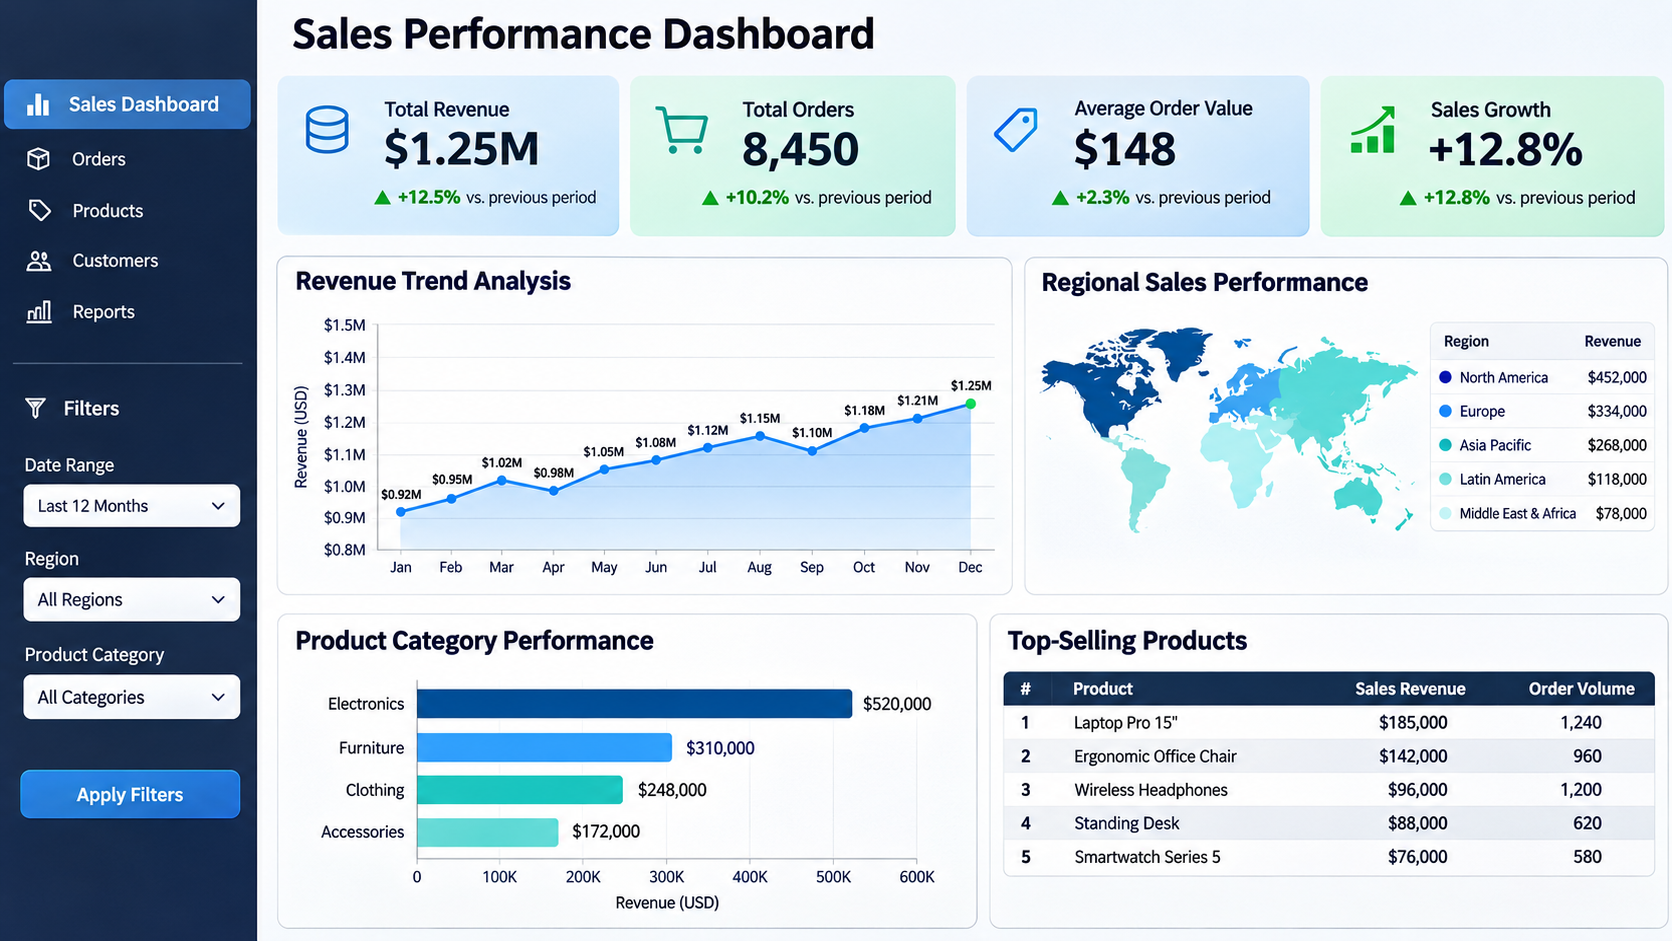
Example of a sales performance BI dashboard displaying key business metrics, revenue trends, regional performance, and product insights.
Step 1. Define the Purpose and Identify Your Audience
Start by identifying why the business needs the dashboard. A dashboard without a clear objective can quickly become a collection of unrelated metrics that offer little value to its users.
Identify the business problem you want to address. Are you trying to monitor sales performance, understand customer behavior, track financial performance, or measure operational efficiency?
Once you establish the objective, identify the intended audience. Different users need different levels of information.
The same business data can support different dashboards depending on who uses it.
Consider a company that wants to monitor sales performance across different regions. Its executives may need an overview of total revenue and sales growth. Regional managers may need location-specific figures, while analysts may want access to individual product and customer records.
You may need separate dashboard pages or role-specific views to address these requirements.
Step 2. Identify the Right KPIs and Metrics
After defining the dashboard’s purpose, decide which metrics will help users measure progress toward their business objectives.
Key Performance Indicators (KPIs) are measurable values that indicate how effectively a business is achieving its goals. Supporting metrics provide additional information that helps users understand those KPIs.
The metrics you select should directly relate to the dashboard’s purpose. Including too many numbers can make it difficult for users to identify important information.
Choose metrics based on the decisions users need to make. A finance dashboard may focus on cash flow and expenses, while a marketing dashboard may prioritize lead generation and campaign performance.
Step 3. Collect, Prepare, and Connect Your Data
A BI dashboard is only as reliable as the data behind it. Inaccurate or inconsistent data can lead to misleading reports and poor business decisions.
Start by identifying the data sources required to calculate the selected KPIs. These may include:
- Relational databases such as MySQL, PostgreSQL, and SQL Server.
- CRM platforms that store customer and sales information.
- Enterprise Resource Planning (ERP) systems.
- Excel and CSV files.
- Cloud applications and third-party APIs.
Once you identify the sources, establish how the dashboard will access the information. Most BI platforms provide built-in connectors for popular databases and applications. APIs and custom data pipelines may be necessary for other sources.
Next, prepare the data for analysis.
For example, imagine that a business stores customer information in a CRM system and sales transactions in a separate database. The dashboard needs information from both sources to calculate revenue by customer.
You can connect the datasets using a shared customer ID. The resulting data model allows the dashboard to display customer details alongside their purchase history.
Step 4. Choose the Right Visualizations and Design the Layout
Once the data is ready, decide how to present it. The right visualization makes information easier to understand and helps users spot patterns without sifting through large tables of numbers.
Start by considering three questions:
- What type of data are you working with?
- What information do you want the visualization to communicate?
- Who will use the dashboard?
Your answers will influence the chart types and layout you choose.
Before building the dashboard, create a rough wireframe. This gives you an opportunity to decide where each visualization belongs and how users will navigate the information.
A useful approach is to place the most important information near the top of the dashboard. KPI cards can provide an immediate overview, followed by charts that show performance trends and category-level comparisons.
Keep navigation consistent across these pages. Use clear labels and avoid placing too many visual elements on a single screen.
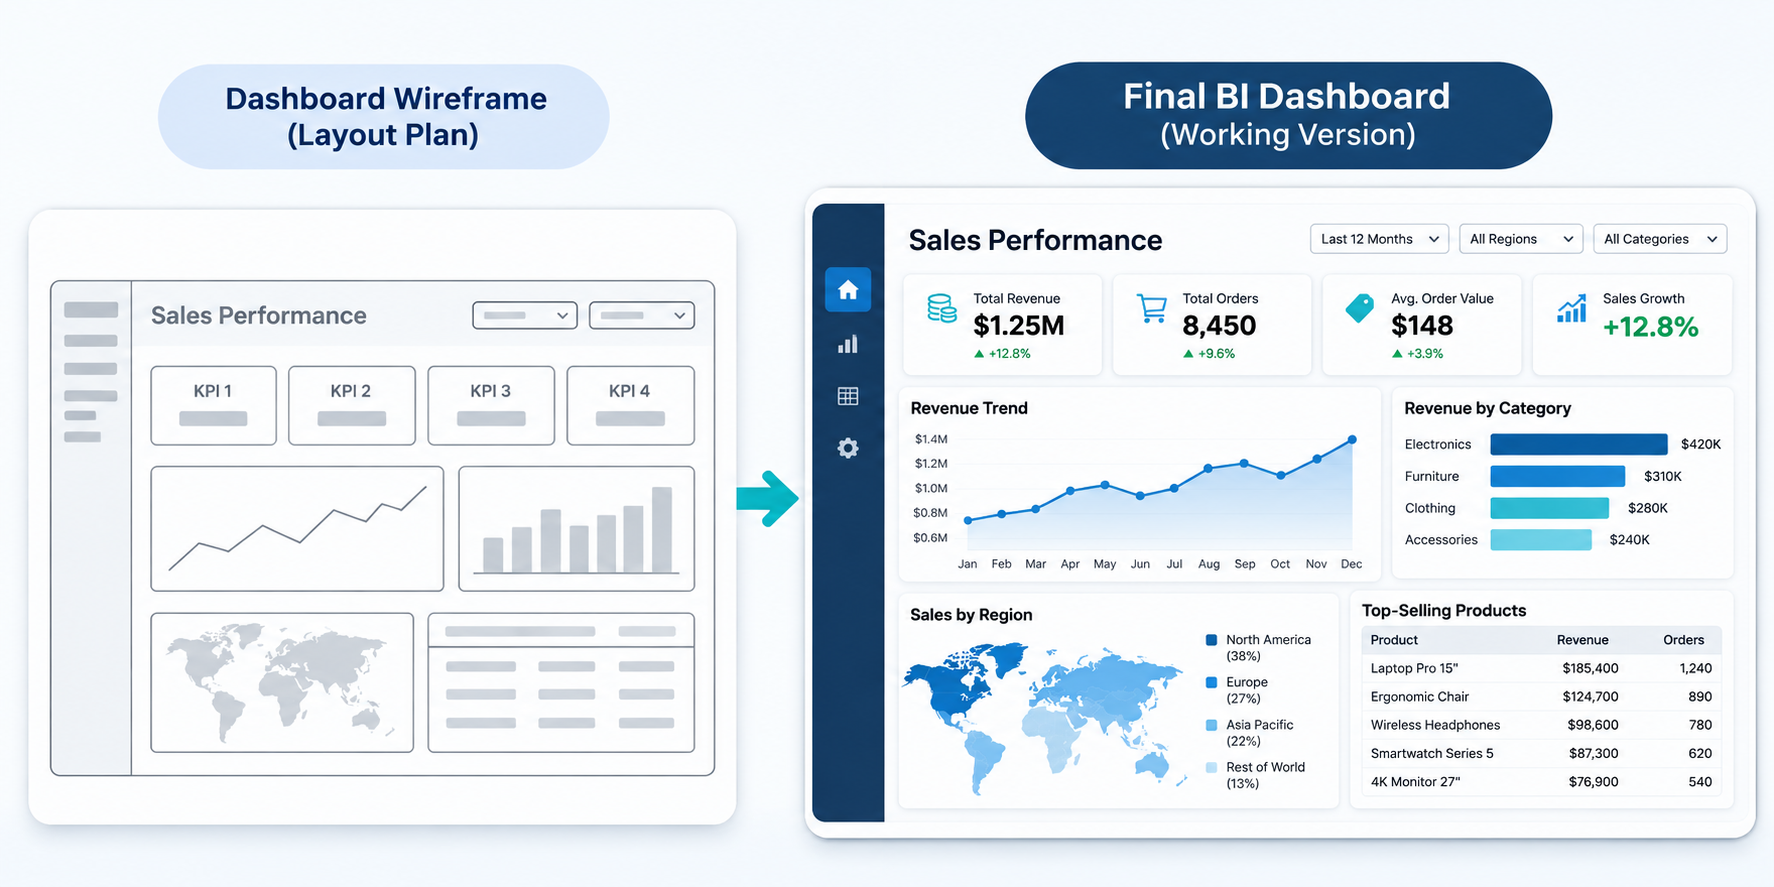
From initial wireframe to final BI dashboard: A visual example of how a layout plan develops into an interactive business intelligence interface.
Step 5. Build the Dashboard Using a BI Tool
After finalizing the layout, start developing the dashboard using a BI platform.
The right tool depends on your data sources, reporting requirements, technical capabilities, and budget.
Common options include Microsoft Power BI, Tableau, and Microsoft Excel.
Once you select a platform, follow these development activities:
- Import or connect the prepared datasets to the BI platform.
- Define relationships between tables and establish the calculations required for the selected KPIs.
- Add the charts, tables, and KPI cards based on the approved wireframe.
- Add filters, slicers, and drill-down features so users can examine specific data segments.
- Create separate views when different business objectives require different levels of detail.
At this stage, review the dashboard as it develops. Compare the interface with the original requirements and adjust as needed.
Step 6. Test, Publish, and Monitor the Dashboard
Dashboard development does not end when the visualizations are complete. Verify that the information is accurate and that users can interact with it as expected.
Start by validating the figures displayed on the dashboard against the original data sources. Check KPI calculations, totals, and historical comparisons. A chart may display correctly but still show incorrect information because of a calculation or data-relationship issue.
Next, test the dashboard’s functionality.
Ask a few intended users to review the dashboard before publishing it. Their feedback can reveal usability issues that may not be apparent during development.
After testing, publish the dashboard through the selected BI platform. Configure access permissions based on user roles and the sensitivity of the information. Financial and customer data may require more restrictive access than general business performance metrics.
Finally, establish a maintenance process. Monitor scheduled refreshes and review the dashboard when business requirements change. New KPIs, additional data sources, or changes to reporting definitions may require updates to the data model and visualizations.
Regular maintenance helps keep the dashboard accurate and relevant as the business evolves.
Tips from our Experts
- Every chart and metric should support the dashboard’s main objective. Remove information that does not help users answer relevant business questions.
- Place critical KPIs and performance indicators where users can find them quickly.
- Maintain consistent fonts, colors, labels, and number formats across dashboard pages.
- Display targets, historical comparisons, or percentage changes alongside current values. A revenue figure becomes more useful when users can compare it with the previous month or a business target.
- Filters and drill-downs should help users explore relevant information without confusing navigation.
- Check how the dashboard appears on desktops, tablets, and mobile devices if users need access across these devices.
Conclusion
Building a useful BI dashboard starts with understanding the business questions it needs to answer. The six-step process helps translate those requirements into a working dashboard, from KPI selection and data preparation to visualization, testing, and publication.
The final dashboard’s quality depends on data accuracy and how effectively it presents information to its intended users. Careful planning and regular validation help businesses create dashboards that support informed decisions.
Businesses looking to turn their data into actionable insights can explore our Business Intelligence Services for custom dashboard development, data integration, and AI-powered business analytics.

