


Please Note: This article is part of our historical archive. Because it was published a while ago, some of the information, links, or context may now be outdated.
Wondering how to install Metricbeat on CentOS 7? We can help you.
Here at Bobcares, we assist our customers with several installations as part of our Server Management Services.
Today, let us focus on the various steps to install Metricbeat on CentOS 7
Install Metricbeat on CentOS 7
In this article, we will use Metricbeat to forward local system metrics like CPU/memory/disk usage and network utilization from a CentOS 7 server to another server of the same kind with the Elastic Stack installed.
With this shipper, we will gather the basic metrics that we need to get the current state of our server.
In order to install Metricbeat on CentOS 7, our Support Techs suggest to have:
1. Two CentOS 7 servers with a non-root user with
sudofirewalld2. On one server, download the Elastic Stack, which refers to as “Elastic Stack server”. This server will have 4GB of RAM and 2 CPUs, will monitor the second server, which refers to as the “second CentOS server”.
Let us now look into the details of the Metricbeat installation. Here are a few steps our Support Engineers found the best fit.
Step 1 – Configure Elasticsearch to Listen for Traffic on an External IP
To begin, we configure the Elastic Stack components to interact with the external IP address.
Log in to Elastic Stack server as a non-root user:
$ ssh bob@Elastic_Stack_server_ip
Use any text editor to edit Elasticsearch’s main configuration file,
elasticsearch.yml$ sudo vi /etc/elasticsearch/elasticsearch.yml
Then we find the following section and modify it so that Elasticsearch listens on all interfaces. Enter insert mode by pressing
i… network.host: 0.0.0.0 …
The address
0.0.0.0Once done, we press
ESC :wqENTERsystemctl$ sudo systemctl restart elasticsearch
Now, we allow access to the Elasticsearch port from the second CentOS server. In order to configure access coming from specific IP addresses or subnets, we use the rich rule functionality of
firewalld$ sudo firewall-cmd –permanent –zone=public –add-rich-rule=’rule family=”ipv4″ source address=”second_centos_server_ip/32″ port protocol=”tcp” port=”9200″ accept’
Rich rules allow us to create more complex and customizable
firewalldIn this command, we are adding a rule that accepts ipv4 traffic from the source, which we have set as the IP address of the second CentOS server, to port 9200 of our Elastic Stack server.
Next, reload firewalld
to activate the new rule:
firewalld$ sudo firewall-cmd –reload
We repeat these commands for each server. If the servers are on the same network, we can allow access using one rule for all hosts on the network.
To do this, we need to replace the
/32/24Next, we test the connection. Log in to the second CentOS server as the non-root user:
$ ssh bob@second_centos_server_ip
We use the curl command to test the connection to the Elastic Stack server:
$ curl Elastic_Stack_server_ip:9200
The output will be similar to the following:
Output
{
“name” : “tl5Is5f”,
“cluster_name” : “elasticsearch”,
“cluster_uuid” : “W9AcSNWHQ3mYs2uE8odklA”,
“version” : {
“number” : “6.7.0”,
“build_flavor” : “default”,
“build_type” : “rpm”,
“build_hash” : “3bd3e59”,
“build_date” : “2019-03-06T15:16:26.864148Z”,
“build_snapshot” : false,
“lucene_version” : “7.6.0”,
“minimum_wire_compatibility_version” : “5.6.0”,
“minimum_index_compatibility_version” : “5.0.0”
},
“tagline” : “You Know, for Search”
}
Now that we know the connection works, we are ready to send metrics to the Elastic Stack server.
Step 2 – Install and Configure Metricbeat on the Elastic Stack Server
We will first install Metricbeat on the Elastic Stack server and import all the data. Moving ahead, we will install and configure the client on the second CentOS server.
First, we log into the Elastic Stack server as the non-root user:
$ ssh bob@Elastic_Stack_server_ip
Since we previously set up the Elasticsearch repositories in the prerequisite, we only need to install Metricbeat:
$ sudo yum install metricbeat
Once the installation is complete, we load the index template into Elasticsearch.
An Elasticsearch index is a collection of documents that have similar characteristics. Our Elasticsearch server will automatically apply the index template when we create a new index.
To load the template, we use the following command:
$ sudo metricbeat setup –template -E ‘output.elasticsearch.hosts=[“localhost:9200”]’
We will see the following output:
Output
Loaded index template
Metricbeat comes packaged with example Kibana dashboards, visualizations, and searches for visualizing Metricbeat data in Kibana. Before we can use the dashboards, we need to create the index pattern and load the dashboards into Kibana.
To load the templates, we use the following command:
$ sudo metricbeat setup -e -E output.elasticsearch.hosts=[‘localhost:9200’] -E setup.kibana.host=localhost:5601
We will see output that looks like this:
Output
…
2019-03-20T09:51:32.096Z INFO instance/beat.go:281 Setup Beat: metricbeat; Version: 6.7.0
2019-03-20T09:51:32.136Z INFO add_cloud_metadata/add_cloud_metadata.go:323 add_cloud_metadata: hosting provider type detected as digitalocean, metadata={“instance_id”:”133130541″,”provider”:”digitalocean”,”region”:”fra1″}
2019-03-20T09:51:32.137Z INFO elasticsearch/client.go:165 Elasticsearch url: http://localhost:9200
2019-03-20T09:51:32.137Z INFO [publisher] pipeline/module.go:110 Beat name: elastic
2019-03-20T09:51:32.138Z INFO elasticsearch/client.go:165 Elasticsearch url: http://localhost:9200
2019-03-20T09:51:32.140Z INFO elasticsearch/client.go:721 Connected to Elasticsearch version 6.7.0
2019-03-20T09:51:32.148Z INFO template/load.go:130 Template already exists and will not be overwritten.
2019-03-20T09:51:32.148Z INFO instance/beat.go:894 Template successfully loaded.
Loaded index template
Loading dashboards (Kibana must be running and reachable)
2019-03-20T09:51:32.149Z INFO elasticsearch/client.go:165 Elasticsearch url: http://localhost:9200
2019-03-20T09:51:32.150Z INFO elasticsearch/client.go:721 Connected to Elasticsearch version 6.7.0
2019-03-20T09:51:32.151Z INFO kibana/client.go:118 Kibana url: http://localhost:5601
2019-03-20T09:51:56.209Z INFO instance/beat.go:741 Kibana dashboards successfully loaded.
Loaded dashboards
Now we can start Metricbeat:
$ sudo systemctl start metricbeat
To make Metricbeat start automatically at boot from now on, we use the enable command:
$ sudo systemctl enable metricbeat
Metricbeat will begin shipping the system stats into Elasticsearch.
To verify that Elasticsearch is indeed receiving this data, query the Metricbeat index with this command:
$ curl -XGET ‘http://localhost:9200/metricbeat-*/_search?pretty’
We will see an output that looks similar to this:
Output
…
{
“took” : 3,
“timed_out” : false,
“_shards” : {
“total” : 1,
“successful” : 1,
“skipped” : 0,
“failed” : 0
},
“hits” : {
“total” : 108,
“max_score” : 1.0,
“hits” : [
{
“_index” : “metricbeat-6.7.0-2019.03.20”,
“_type” : “doc”,
“_id” : “A4mU8GgBKrpxEYMLjJZt”,
“_score” : 1.0,
“_source” : {
“@timestamp” : “2019-03-20T09:54:52.481Z”,
“metricset” : {
“name” : “network”,
“module” : “system”,
“rtt” : 125
},
“event” : {
“dataset” : “system.network”,
“duration” : 125260
},
“system” : {
“network” : {
“in” : {
“packets” : 59728,
“errors” : 0,
“dropped” : 0,
“bytes” : 736491211
},
“out” : {
“dropped” : 0,
“packets” : 31630,
“bytes” : 8283069,
“errors” : 0
},
“name” : “eth0”
}
},
“beat” : {
“version” : “6.7.0”,
“name” : “elastic”,
“hostname” : “elastic”
},
…
The line
“total” : 108Any number of search results indicates that Metricbeat is working; if the output shows 0 total hits, we will need to review the setup for errors. If we receive the expected output, we continue to the next step.
[Stuck with the installation? We are available 24*7]
Step 3 – Install and Configure Metricbeat on the Second CentOS Server
We perform this step on all CentOS servers we want to send metrics to the Elastic Stack server.
Log into the second CentOS server as the non-root user:
$ ssh bob@second_centos_server_ip
The Elastic Stack components are not available through the yum package manager by default. However, we can install them by adding Elastic’s package repository.
In this step, we will import the Elasticsearch public GPG key and add the Elastic package source list in order to install Metricbeat.
To begin, we run the following command to download and install the Elasticsearch public signing key:
$ sudo rpm –import https://artifacts.elastic.co/GPG-KEY-elasticsearch
Next, we add the Elastic repository. Use any text editor to create the file
elasticsearch.repo/etc/yum.repos.d/$ sudo vi /etc/yum.repos.d/elasticsearch.repo
To provide yum with the information it needs to download and install the components of the Elastic Stack, enter insert mode by pressing
i[elasticsearch-6.x] name=Elasticsearch repository for 6.x packages baseurl=https://artifacts.elastic.co/packages/6.x/yum gpgcheck=1 gpgkey=https://artifacts.elastic.co/GPG-KEY-elasticsearch enabled=1 autorefresh=1 type=rpm-md
Once done, save and close the file.
Next, we install Metricbeat with this command:
$ sudo yum install metricbeat
Once the Metricbeat installation is complete, we configure it to connect to Elasticsearch.
To open its configuration file,
metricbeat.yml$ sudo vi /etc/metricbeat/metricbeat.yml
Metricbeat’s configuration file is in YAML format, which means that indentation is very important. We make sure to not add any extra spaces as we edit this file.
Metricbeat supports numerous outputs, but we usually send events directly to Elasticsearch or to Logstash for additional processing.
Find the following section and update the IP address:
#————————– Elasticsearch output ——————————
output.elasticsearch:
# Array of hosts to connect to.
hosts: [“Elastic_Stack_server_ip:9200”]
…
Save and close the file.
We can extend the functionality of Metricbeat with modules. Here, we use the system module, it allows to monitor server stats like CPU/memory/disk usage and network utilization.
In this case, the system module is enabled by default. To list the modules, we run:
$ sudo metricbeat modules list
We will see a list similar to the following:
Output
Enabled:
system

Disabled:
aerospike
apache
ceph
couchbase
docker
dropwizard
elasticsearch
envoyproxy
etcd
golang
graphite
haproxy
http
jolokia
kafka
kibana
kubernetes
kvm
logstash
memcached
mongodb
munin
mysql
nginx
php_fpm
postgresql
prometheus
rabbitmq
redis
traefik
uwsgi
vsphere
windows
zookeeper
We can see the parameters of the module in the
/etc/metricbeat/modules.d/system.ymlIn this case, we do not need to change anything in the configuration. The default
metricsetsmetricsetNow we can start and enable Metricbeat:
$ sudo systemctl start metricbeat
$ sudo systemctl enable metricbeat
we repeat this step on all servers to collect metrics. After that, we can proceed to see how to navigate through some of Kibana’s dashboards.
Step 4 – Explore Kibana Dashboards
In this step, we will take a look at Kibana, the web interface.
In a web browser, we go to the FQDN or public IP address of the Elastic Stack server. After entering the login credentials, we will see the Kibana homepage.
Then, click the Discover link in the left-hand navigation bar. On the Discover page, we select the predefined
meticbeat-*By default, this will show all of the log data over the last 15 minutes. Here, we can search and browse through the metrics and also customize the dashboard:

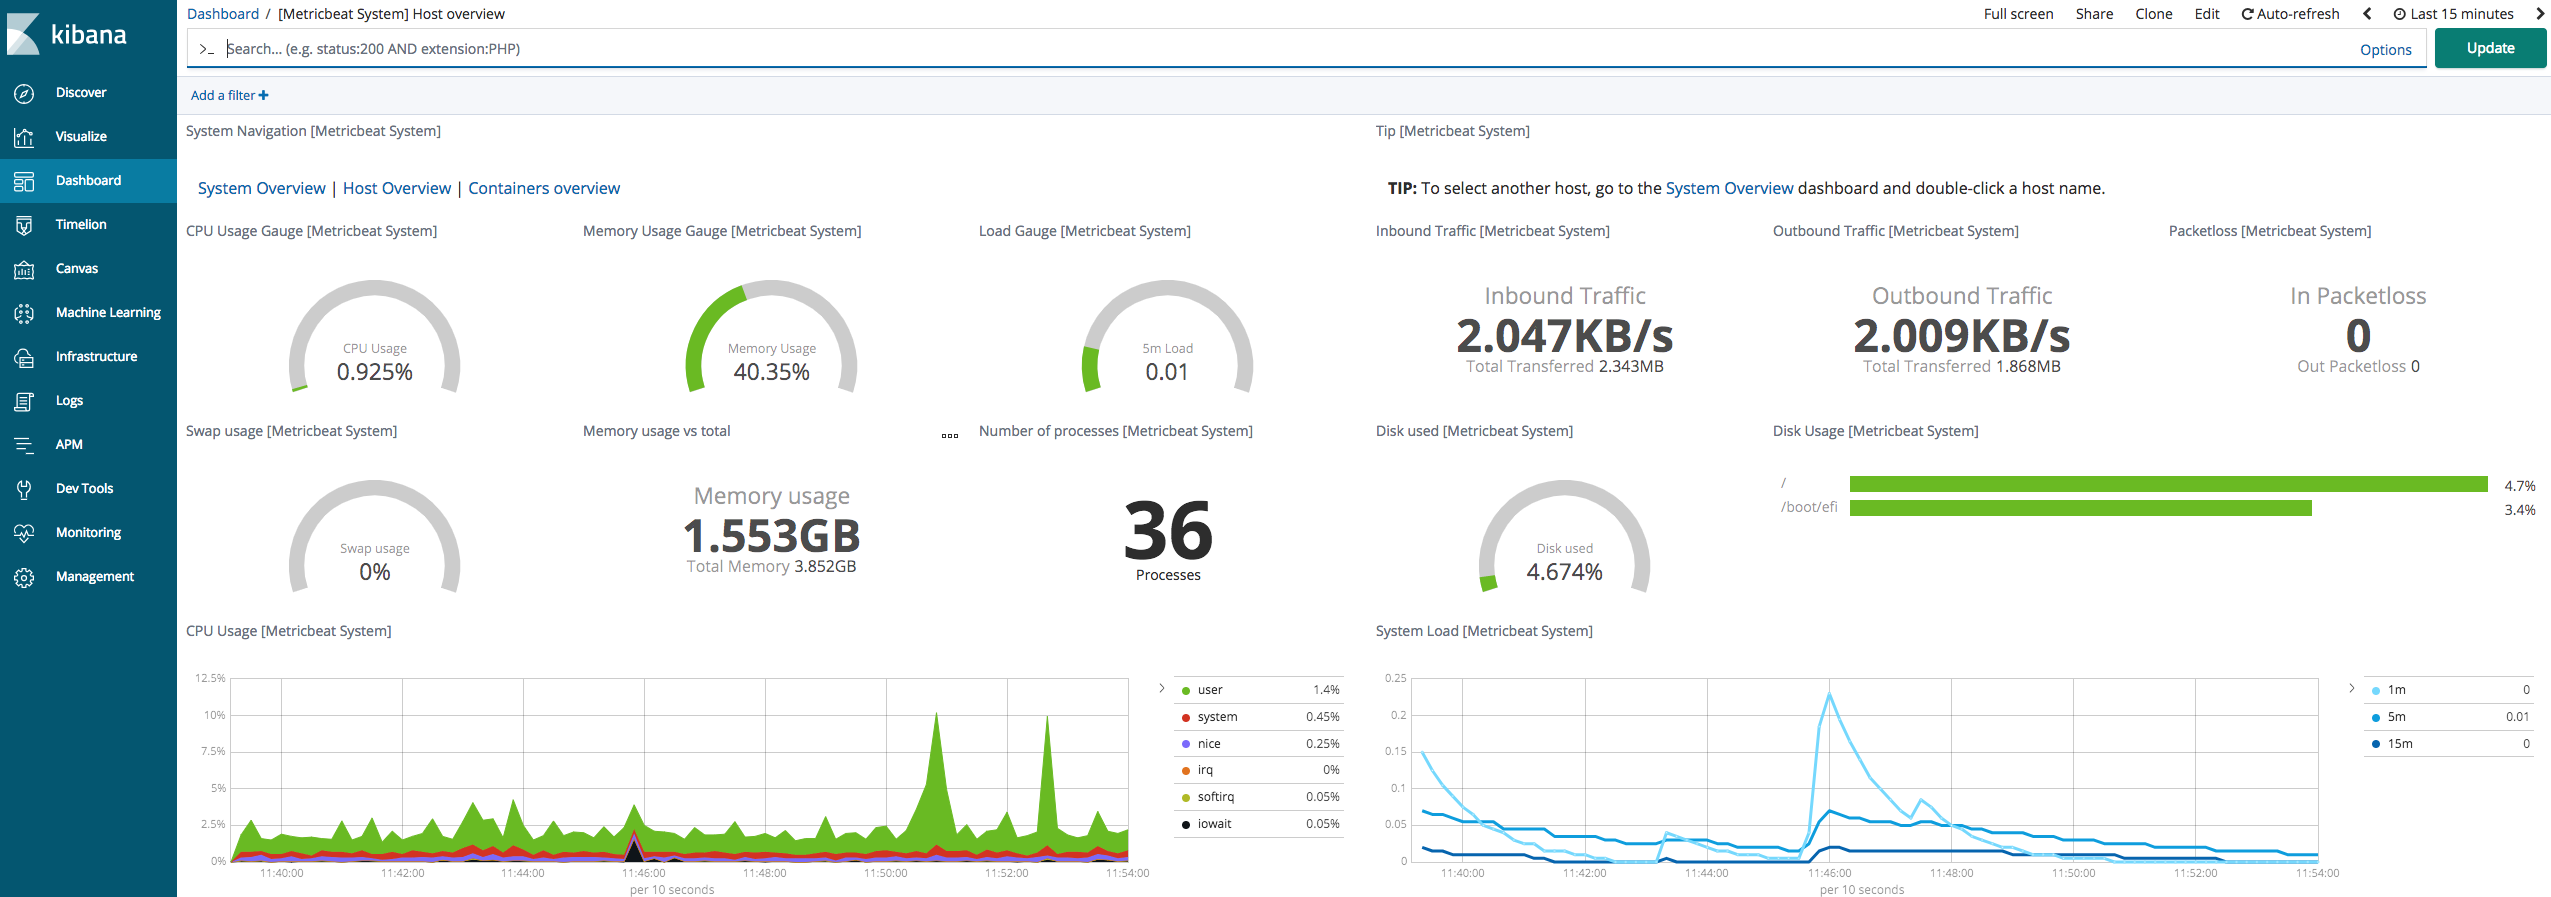
Use the left-hand panel to navigate to the Dashboard page and search for the Metricbeat System dashboard. Once there, we can search for the sample dashboards that come with Metricbeat’s system module.
For example, we can view brief information about all our hosts:

We can also click on the hostname and view more details:
[Stuck with the procedures? We’d be happy to assist]
Conclusion
To conclude, we saw how our Support Engineers install Metricbeat and configure the Elastic Stack to collect and analyze system metrics.

