


Explore AIOps with OpenTelemetry to unify traces, metrics, logs, and profiles for modern cloud observability, smarter monitoring, and lower costs.
Managing traditional monitoring in distributed systems and microservices becomes challenging. In particular, troubleshooting with dozens or hundreds of services, containers and Kubernetes clusters is a challenge that involves correlating logs, metrics and traces across multiple components.
Previous methods typically involved the use of proprietary agents or several different vendor-specific tools, which were complex and made for vendor lock-in. As a result, telemetry was often gathered in an isolated fashion, and it was hard to link performance problems with root causes.
To address these challenges, OpenTelemetry (OTel) aims to solve this problem by offering a vendor-agnostic, cloud-native approach to creating, gathering, processing, and publishing telemetry data.
An Overview
What Is OpenTelemetry
OpenTelemetry is an open framework for monitoring that resulted from the merger of OpenTracing and OpenCensus under the Cloud Native Computing Foundation (CNCF).
Core Principle: OpenTelemetry is not a data store or platform for viewing data such as Grafana, Datadog, or Honeycomb. It provides standards, APIs, SDKs, and tools that are not tied to one vendor for creating, gathering, handling, and sending monitoring data.
The Core Telemetry Signals
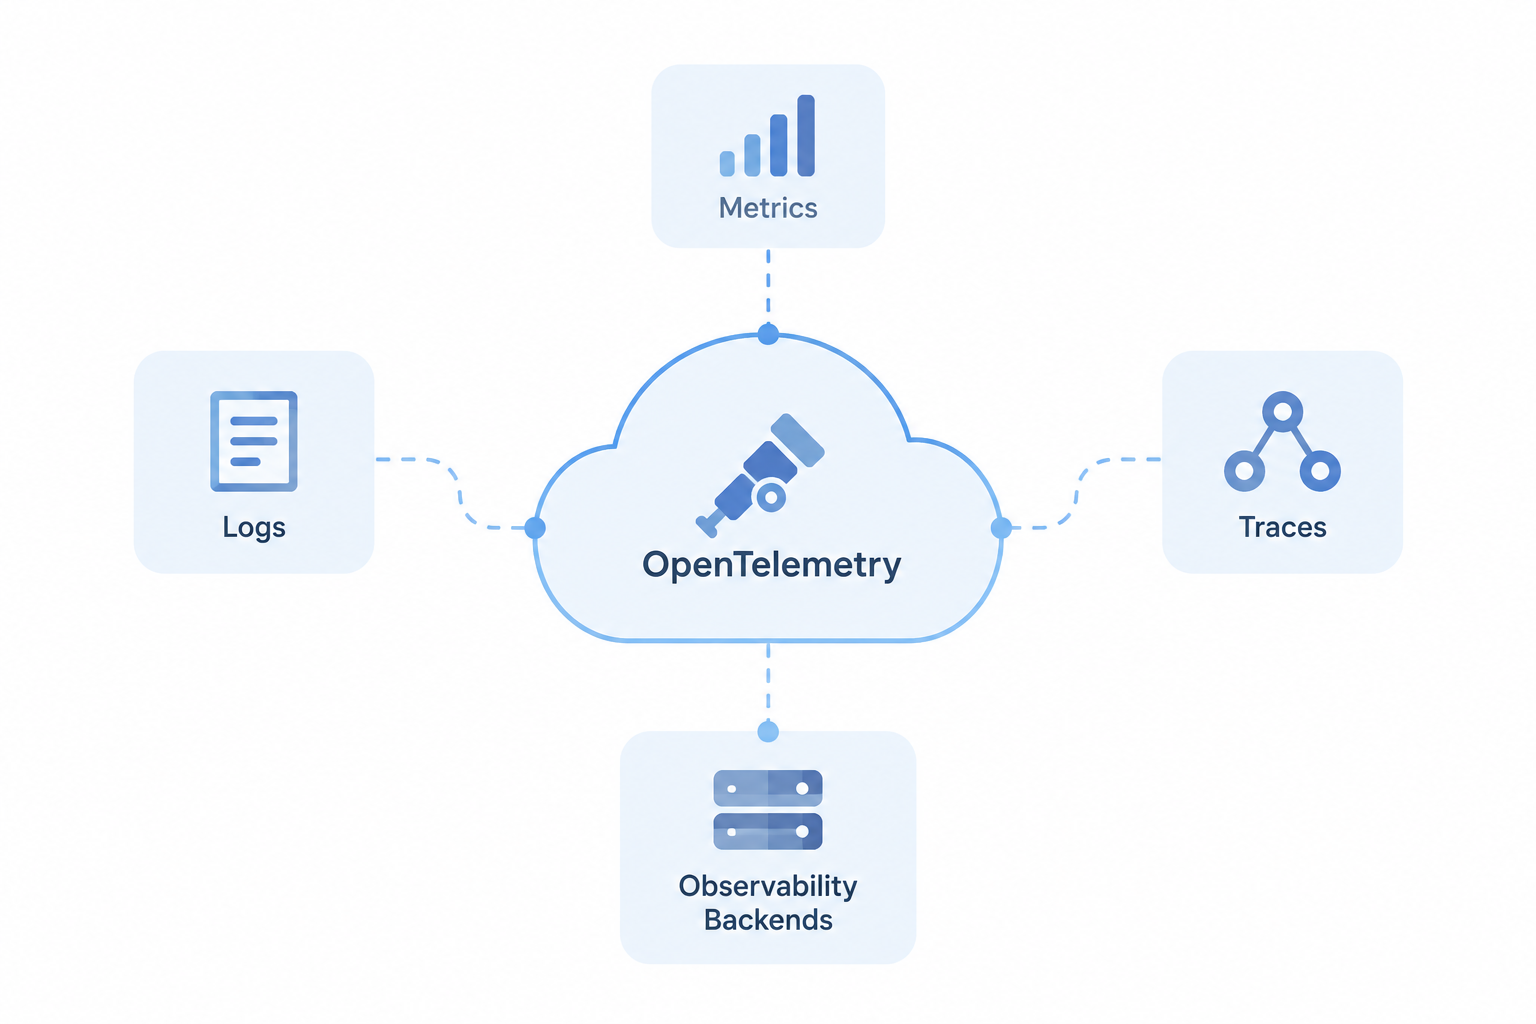
OpenTelemetry focuses on three primary telemetry signals: traces, metrics, and logs. In addition, it provides contextual mechanisms such as Baggage.
Traces and Spans
Trace: A way to follow the entire path of a request through a distributed system.
Span: An operation that is being performed in that request, such as an HTTP handler, database query, or RPC call. For example, spans include timing, status and attribute data.
Metrics
Metrics are numerical measurements gathered over a period of time. For example, examples of metric instruments include:
- Counters: Values that are monotonically increasing, for example, total requests.
- Gauges: Things that can go up or down, like memory usage.
- Histograms: Request latency (p95 or p99).
Modernize Your Observability Today.

Logs
Logs are structured runtime event records. Moreover, OpenTelemetry adds standardized context that helps correlate logs with traces and other telemetry.
This can include:
- TraceId and SpanId: Link logs to execution paths.
- Resource Attributes: Identify the source of telemetry, like k8s.pod.name, cloud.region, and service.name.
Baggage
Baggage, therefore, carries the context of information across process boundaries, including a user identifier, tenant identifier, or datacenter tier. Therefore, care should be taken in teams to propagate values and avoid unauthorised sensitive data.
Key Architectural Components
OpenTelemetry’s architecture separates instrumentation from telemetry transport. As a result, applications can use a common approach for sending telemetry data.
| Component | Responsibility | Purpose |
|---|---|---|
| API | Defines interfaces and data types. | Provides loose coupling for instrumentation. |
| SDK | Implements the API for languages such as Go, Java, Python, Node.js, and Rust. | Handles state, batching, resource detection, sampling, and serialization. |
| OTLP | OpenTelemetry Protocol. | Transports telemetry over gRPC (4317) or HTTP (4318). |
The OpenTelemetry Collector
The OpenTelemetry Collector is a standalone service for receiving, processing, and exporting telemetry. It separates applications from observability backend vendors.
A Collector pipeline typically uses receivers, processors, and exporters, with connectors available for routing data between pipelines.
- Receivers: Gather telemetry data from various sources like OTLP, Syslog, Jaeger, Zipkin and Prometheus.
- Processors: Alter telemetry data during flight. Common examples include batch, memory_limiter, tail_sampling, and redaction.
- Exporters: Push processed telemetry to destinations like Prometheus, Datadog, Elasticsearch or other supported backends.
In addition, tail sampling may store all the traces compliant with policies (e.g., error or high latency) and sample routine successful traces.
Instrumentation Auto vs. Manual
Zero-Code Auto-Instrumentation
They can be either Java agents, Python auto-instrumentation, or alternatively, approaches using eBPF.
It is helpful for quickly capturing all common activities like HTTP requests, database calls, and framework latency.
Manual Programmatic Instrumentation
Manual instrumentation involves directly embedding the OpenTelemetry API into application code. With this approach, it enables teams to record business-specific workflows, such as checkout processes, payment gateway timeouts, and background processes.
Moreover, teams should ensure that they record attributes that carry meaningful business meaning while avoiding attributes that are high-cardinality.
Example: Manual Tracing with the OpenTelemetry Python SDK
from opentelemetry import trace

from opentelemetry.trace import Status, StatusCode

tracer = trace.get_tracer(__name__)

def process_order(order_id: str, amount: float):

with tracer.start_as_current_span("process_payment") as span:

span.set_attribute("order.id", order_id)

span.set_attribute("payment.amount", amount)

try:

execute_gateway_charge(amount)

except PaymentGatewayError as exc:

span.record_exception(exc)

span.set_status(

Status(StatusCode.ERROR, description=str(exc))

)

raise
Why OpenTelemetry Is the Industry Future
- Vendor Independence: Applications can send telemetry to different backends by changing Collector configurations.
- Semantic Conventions: Standardized attribute names make services and languages more consistent and more correlated.
- Cost Governance: Collector-level filtering and sampling can minimize telemetry ingestion.
- eBPF Integration: eBPF-based solutions offer more visibility of the runtime and network behaviour without requiring much instrumentation of applications.
The Emerging Fourth Signal Profiles
OpenTelemetry Profiles has entered public Alpha and is being developed as an emerging fourth signal alongside traces, metrics, and logs.
In addition, profiling provides information about CPU, memory, and other resource consumption over time. OpenTelemetry aims to correlate profiling data with traces and metrics and make it available through the same vendor-neutral ecosystem.
Conclusion
Observability is moving away from siloed, tool-specific systems toward a more standard approach. In this way, OpenTelemetry provides a common layer between application code and system monitoring tools.
By doing so, teams can control costs, protect sensitive data, and send telemetry to different analysis platforms without changing their application instrumentation.
As cloud platforms continue to change, OpenTelemetry is more than a way to modernize monitoring. Instead, it provides a flexible foundation that is not tied to one vendor for building a long-term monitoring strategy.

