


Get proactive outsourced hosting support with WordPress monitoring, automated alerts, and early issue detection for reliable site operations.
Proactive WordPress monitoring helps support teams spot issues before a site becomes unresponsive. The process starts with collecting site and server metrics, then comparing current activity with normal operating ranges.
Once an alert crosses a defined severity level, the system creates a support ticket with logs, metrics, and a probable cause. Agents can then review the findings, confirm the cause, and apply the required fix.
An Overview
Monitoring Architecture
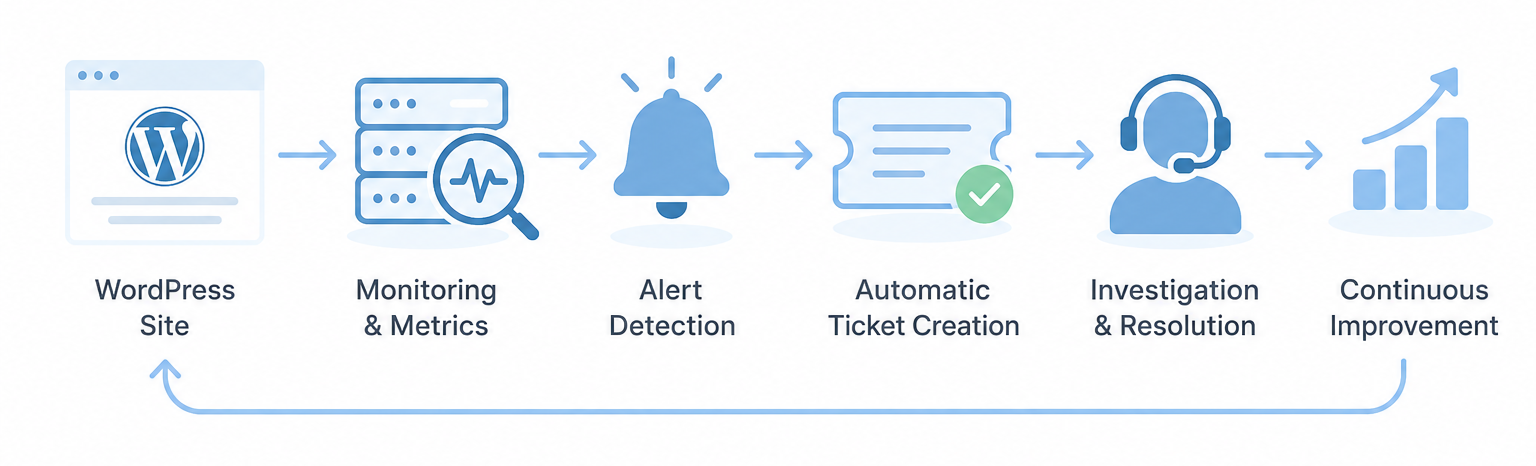
The monitoring architecture connects WordPress sites and servers with automated alerts, ticket creation, agent investigation, and feedback.
The flow covers:
- WordPress sites and servers
- Metric collection
- Baseline creation
- Alert detection
- Automatic ticket creation
- Agent investigation
- Resolution feedback
How Proactive WordPress Monitoring Works
1. Establish a Baseline
The system collects historical data for CPU, memory, disk I/O, query times, and PHP-FPM worker use. This data helps define normal operating ranges for each site and server.
2. Collect Metrics Continuously
Lightweight agents and plugins collect real-time data from areas such as:
- PHP-FPM status
- MySQL slow query logs
- Cache hit and miss ratios
- Cron execution times
Talk to us for support.

3. Detect Changes Through Thresholds
The monitoring system checks for changes in key metrics. For example, a rise in PHP-FPM queue depth, slow queries, or memory use can trigger an alert before the site becomes unresponsive.
4. Create Support Tickets Automatically
When an alert reaches the defined severity level, the system creates a support ticket. The ticket includes relevant logs, a metrics snapshot, and a probable cause.
5. Correlate Related Issues
The correlation engine links related events to narrow down the probable cause. For example, a rise in slow queries can be linked with a recent plugin update.
6. Investigate and Apply the Fix
Support agents review the pre-diagnosed ticket and confirm the cause. They can then apply fixes such as query optimization, cache reconfiguration, or PHP-FPM tuning.
7. Feed Results Back Into Monitoring
Resolved incidents feed back into the baseline model. Over time, this helps refine thresholds and reduce false alerts.
Rollout Methodology
The monitoring system was rolled out in phases so the team could establish baselines, tune alerts, and update support workflows before fleet-wide use.
| Phase | Focus |
|---|---|
| Discovery and Baselining | Collect historical metrics and define normal operating ranges |
| Pilot Deployment | Test a limited set of alert rules with the monitoring team |
| Full Rollout | Extend monitoring across the fleet and connect automated tickets to the helpdesk. |
| Continuous Tuning | Review thresholds, correlation rules, and baseline windows |
Discovery and Baselining
The team first monitored a representative group of servers and sites without sending customer-facing alerts. This covered different site profiles, including low-traffic brochure sites, WooCommerce stores, and high-traffic blogs.
Pilot Deployment
Next, selected alert rules were tested with a pilot group. Alerts went to the monitoring team rather than the customer-facing ticket queue. This allowed the team to tune thresholds without affecting support operations.
Full Rollout
After the pilot reached an acceptable signal-to-noise ratio, the monitoring stack was extended across the fleet. Automated ticket creation was also connected to the live helpdesk.
Continuous Tuning
The team continued to review thresholds, correlation rules, and baseline windows against resolved tickets. New WordPress-specific checks were also added as recurring issue patterns appeared.
Before vs. After: Support Workflow Comparison
| Before | After |
|---|---|
| Support teams rely on issues becoming visible before investigation | Monitoring detects changes before a site becomes unresponsive |
| Agents need to investigate the available issue details | Tickets include logs, metrics, and a probable cause |
| Related metrics require manual review | The correlation engine links related events |
| Thresholds need ongoing review based on support outcomes | Resolved incidents feed back into the baseline model |
| Support workflows lack pre-diagnosed ticket details | Agents receive pre-diagnosed tickets and validate the cause |
Conclusion
Proactive WordPress monitoring connects metric collection, alerts, ticket creation, investigation, and feedback in one support workflow. As a result, teams can identify changes earlier, give agents useful diagnostic details, and refine monitoring based on resolved incidents.

