Let us learn more about the VULTR Kubernetes dashboard with the support of our Vultr support services at Bobcares.
Deploy and Access the Kubernetes Dashboard with VULTR

Dashboard is a Kubernetes user interface that is accessible over the web. Dashboard may be used to deploy containerized apps to a Kubernetes cluster, debug containers, and manage cluster resources.
We can use the dashboard to receive an overview of the apps operating on the cluster as well as to create or change specific Kubernetes resources (such as Deployments, Jobs, DaemonSets, and so on).
We can, for example, use a deploy wizard to scale a Deployment, start a rolling update, restart a pod, or deploy additional apps.
The dashboard also shows the status of Kubernetes resources in the cluster as well as any faults that may have occurred.
Deploying the Dashboard UI
The Dashboard user interface is not enabled by default. Run the following command to deploy it:
apply kubectl -f https://raw.githubusercontent.com/kubernetes/dashboard/v2.7.0/aio/deploy/recommended.yamlAccessing the Dashboard UI
Dashboard installs with a simple RBAC setup by default to safeguard the cluster data. Dashboard currently only allows logging in with a Bearer Token.
Warning: The tutorial’s example user will have administrator capabilities and is strictly for educational purposes.
Command line proxy
We may enable Dashboard access using the kubectl command-line tool by typing the following command:
kubectl proxyDashboard will be accessible through Kubectl at http://localhost:8001/api/v1/namespaces/kubernetes-dashboard/services/https:kubernetes-dashboard:/proxy/.
The UI is only accessible from the system where the command is run. For additional information, run kubectl proxy –help.
External identity providers and X.509 certificate-based authentication are not supported by the kubeconfig authentication technique.
Welcome view
The welcome page will be displayed when we access Dashboard on an empty cluster.
This page includes a link to this article as well as a button that allows us to deploy the first application.
Furthermore, we can see which system apps, such as the Dashboard, are running by default under the cluster’s kube-system namespace.
Deploy the latest Kubernetes dashboard
We can get started once we’ve built up the Kubernetes cluster or if we already have one operating.
The first thing to know about the web UI is that it can only be accessed using the computer it is running on’s localhost address. This necessitates the establishment of an SSH tunnel to the server.
This command can construct an SSH tunnel on most operating systems. Replace -user- and -master_public_IP- with the required Kubernetes cluster information.
ssh -L localhost:8001:127.0.0.1:8001 -user-@-master_public_IPAfter we’ve signed in, we can use the following command to deploy the dashboard.
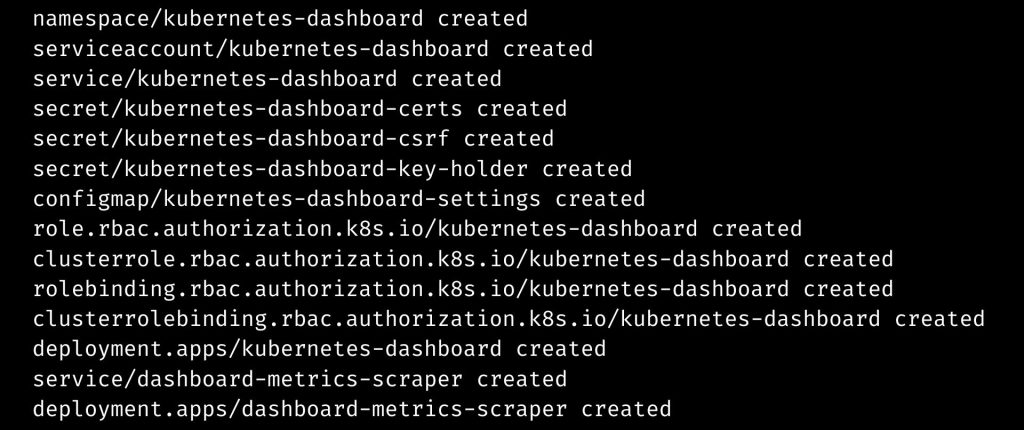
kubectl apply -f https://raw.githubusercontent.com/kubernetes/dashboard/v2.0.0/aio/deploy/recommended.yamlIf the cluster is functioning well, we should get an output indicating the formation of a number of Kubernetes components, as seen in the following example.

After that, the cluster should have two new pods functioning.
kubectl get pods -A

...

kubernetes-dashboard   dashboard-metrics-scraper-6b4884c9d5-v4z89   1/1     Running   0          30m

kubernetes-dashboard   kubernetes-dashboard-7b544877d5-m8jzk        1/1     Running   0          30m
We may then proceed with generating the necessary user accounts.
[Need assistance with similar queries? We are here to help]
Conclusion
To sum up we ahve noiw seen more on vultr kubernetes dashboard with the support of our tech support team.
PREVENT YOUR SERVER FROM CRASHING!
Never again lose customers to poor server speed! Let us help you.
Our server experts will monitor & maintain your server 24/7 so that it remains lightning fast and secure.


0 Comments