Quick Facts-
- Google recommends sites to respond within 200 milliseconds and load within 2 seconds.
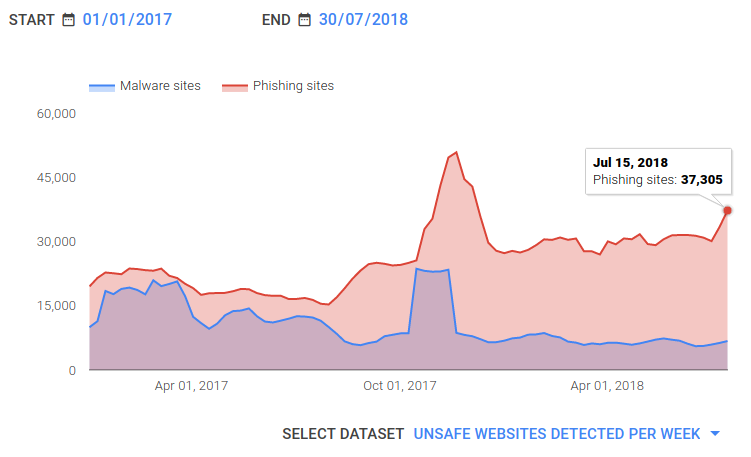
- Google identifies around 40,000 infected websites in a week.

As you can see, if your site isn’t secure or fast, it will rank below your competition.
At Bobcares, we help web hosts, digital marketers and website owners prevent SEO penalty through 24/7 monitoring & lightning fast emergency response.
Today we’ll see how we monitor Apache web servers. The metrics we choose, why we choose them and how we recover from issues.
Metrics to be monitored in Apache
- Performance- Performance bottlenecks cause slower sites, resulting in SEO ranking to go down.
- Security- Unaddressed security issues prompt Google to blacklist the site as infected.
- Uptime- Frequent downtimes can cause Google to reduce the crawl rate (pages crawled/day), which can affect the SEO rankings.
Request processing time
Apache processes a client request and then delivers a page as response. The time taken for this process is called Request processing time.
In the servers that we maintain, we have seen that on an average Apache takes around 700 milliseconds to process a request. So, we use this value as our threshold.
What we do when there’s an alert
On receiving notifications, we check if latency is due to Apache itself (like a load spike) or due to other components of the stack like long-running queries in MySQL or slow execution of PHP code, etc.
At Bobcares, we correlate data across different logs to identify the underlying issue. To consult our Server Experts, click here.
Established connections
An increase in this metric is a warning of a performance issue (like resource shortage) or security problem (like a DoS attack which keeps the connections open).
Among the servers that we monitor, we have observed that a shared server may have up to 200 open connections whereas for a single website the maximum connections is around 20. So, we use this information as a basis for customizing the alerts.
What we do when there’s an alert
On receiving an alert, we first figure out if there are enough resources to handle the load. We check for bottlenecks in Disk I/O, CPU, memory etc., and take corrective measures.
If the above mentioned is not the case, then we determine if it’s malicious traffic, like a DDoS attack. If a particular URL or domain was targeted, we can see it in the logs. Or, if all the connections display unusual behavior and so on.
Memory usage
If Apache runs out of memory, it will start swapping to disk causing performance issue. Factors that impact memory usage include- Poor choice of MPMs, unnecessary Apache modules being loaded, unoptimized PHP settings, large number of processes created upon startup etc.
What we do when there’s an alert
We assess the cause for the increase in memory consumption. Depending upon the analysis, we take corrective measures, some of which include-
- Switching from prefork to the worker or event MPM
- Disabling any unnecessary Apache modules
- Lowering the number of processes created upon startup
- Decreasing maximum allowed number of idle worker threads
We also use a reverse proxy or load balancer like Nginx to reduce memory consumption. If none of this work, then we may have to change the architecture to lower memory footprint. We add memory to servers, or scale horizontally to distribute the load among a higher number of servers.
Simply put, there is just too many things involved when it comes to memory usage. Click here to have our experts help you in monitoring it.
URL check
This helps in detecting if there is content change in the webpage. Alerts are customized for key text missing, page size change, etc. For e.g., Current page size is compared with the previous one. If there is around 20% change, it usually points to an attack.
What we do when there’s an alert
We then perform code audits of pages to see if it is infected or if a hidden code has been injected. Based on the information on what changed, we quickly revert the site to the previous version.
At Bobcares, our Server Experts scan for vulnerabilities, applying fixes and patches, implementing firewalls and take measures to prevent such incidents from occurring.
Vulnerability scanning
Hackers use vulnerable points to breach into the server. We perform regular scans to detect any potential security hole.
What we do when there’s an alert
Vulnerability scan is done in Server software, Application software, kernel, etc. Individual web applications like WordPress are also checked. If the latest version software is not being used, then we upgrade it. We use the official patches for the deployed software. If a official patch is not available, then we hotfix it to prevent further exploitation.
Error rate
It is the number of errors per connection. A drastic increase in this number indicates the presence of some underlying issue, like a new undetected error in the website, or a configuration mistake and so on.
What we do when there’s an alert
We take a look at the exact error that is occurring. Then we try determine the underlying issue; whether it is Apache issue, or problem with PHP configuration, or trouble with the hardware components and so on.
In Summary
More monitoring means less escalations. Today we have seen some of the various metrics we constantly keep an eye on and the measures we take to ensure smooth working of Apache Web servers.


0 Comments