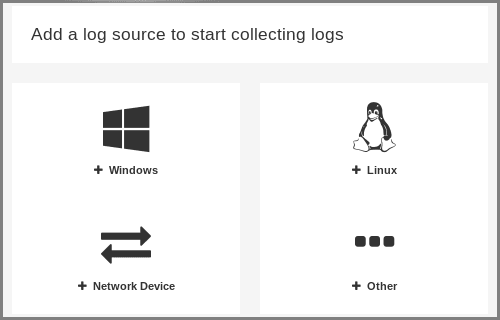
Need to setup Nagios log server to monitor a new log source?
At Bobcares we often get requests from our clients to configure Nagios log server to monitor a new log source.
Today, let’s see how our Support Engineers get this done for our customers as part of our Server Management Services.
How to add a Linux log source?
To set up Nagios log server to monitor a new log source we will be using the Linux log source here though there are multiple other sources
Steps to follow are:
1. First log in to Nagios Log Server and then click on the + Linux button. Alternatively, we can click the + Add Log Source button on the navigation bar and then click on the Linux button.

2. After taking Linux Source Setup, we can see a code block with instructions on how to download and run the setup-linux.sh script.
3. This script will automatically configure rsyslog to send syslogs to Nagios Log Server. Also, a code block will populate with the address and port of the Nagios Log Server.
4. Copy the code to the clipboard and open the command prompt on the Linux machine that we want to configure to send logs to the Nagios Log server as the root user.
5. Now paste the code that has been copied into the clipboard into the terminal session, this will download the script and run it.
A successful run of the setup-linux.sh script is given below:
[root@centos16 ~]# curl -sS -O http://10.25.5.86/nagioslogserver/scripts/setup-linux.sh
[root@centos16 ~]# sudo bash setup-linux.sh -s 10.25.5.86 -p 5544
Detected rsyslog 5.8.10
Detected rsyslog work directory /var/lib/rsyslog
Destination Log Server: 10.25.5.86:5544
Creating /etc/rsyslog.d/99-nagioslogserver.conf...
rsyslog configuration check passed.
Restarting rsyslog service with 'service'...
Shutting down system logger: [ OK ]
Starting system logger: [ OK ]
Okay.
Rsyslog is running with the new configuration.
Visit your Nagios Log Server dashboard to verify that logs are being received.Copy Code
6. Once we get similar output from the setup script, go to the Dashboard page to verify that we are receiving logs (click Dashboards on the top navigation bar).
7. Then perform a query using the IP address of the logs from the server that we ran the script on.

8. To force a log entry to be sent, execute the following command on Linux machine:
logger This is a test log entryCopy Code
The actual location of the script “setup-linux.sh” on Nagios Log Server instance is:
/var/www/html/nagioslogserver/www/scripts/setup-linux.shCopy Code
We can see the test log entry, this confirms that Nagios Log Server is receiving logs from the Linux machine.
[Need further assistance? We are here for you!]
Conclusion
In this article, we discussed configuring Nagios log server to monitor a new log source. Also, we saw the method that our Support Engineers use to set this up.


0 Comments