ntop is a network traffic tool that shows network usage in real time. It displays a list of hosts that are currently using the network and reports information concerning the IP (Internet Protocol) and Fibre Channel (FC) traffic generated by each host. The traffic is sorted according to host and protocol. Protocols (user configurable) include:
Hire Bobcares Linux Server Administrators
Get super reliable servers and delighted customers
    * TCP/UDP/ICMP
    * (R)ARP
    * IPX
    * DLC
    * Decnet
    * AppleTalk
    * Netbios
    * TCP/UDP
          o FTP
          o HTTP
          o DNS
          o Telnet
          o SMTP/POP/IMAP
          o SNMP
          o NFS
          o X11
One of the good things about this tool is that you can use a web browser to manage and navigate through ntop traffic information to better understand network status.
    * a web interface

    * limited configuration and administration via the web interface

    * reduced CPU and memory usage (they vary according to network
      size and traffic)
make ntop easy to use and suitable for monitoring various kind of networks.
2. Prerequisites
Ntop 3.2
LIBPCAP
GDBM
libpcap is a system-independent interface for user-level packet capture. libpcap provides a portable framework for low-level network monitoring.
3. Download
Please download the G-LIB rpm as well as ntop rpms.
http://dag.wieers.com/rpm/packages/ntop
http://rpmfind.net/linux/RPM/fedora/4/i386/glib-1.2.10-16.i386.html
4. Installation
1- Installing G-LIB:
# wget ftp://download.fedora.redhat.com/pub/fedora
            /linux/core/4/SRPMS/glib-1.2.10-16.src.rpm
# rpm -ivh  glib-1.2.10-16.i386.rpm
2- Installing ntop:
# wget http://dag.wieers.com/rpm/packages
             /ntop/ntop-3.2-1.el3.rf.i386.rpm
# rpm -ivh ntop-3.2-1.el3.rf.i386.rpm
5. Running ntop
1- Initialize ntop:
ntop :That will initialize ntop and it will ask you to enter your username and password.
The default username: admin
Please enter the password for the admin user:
Please enter the password again:
Once the admin password set, you will get a message at the command prompt something like.
"Thu 22 Mar 2007 11:01:04 PM MDT Admin user password has been set"
2- Start ntop service:
# service ntop start
Starting ntop:                                             [  OK  ]
6. Log In To The Web Interface
ntop can be managed through a web interface. You can enter your server address in your web browser:
http://ServerIP:3000
https://ServerIP:3001
Now you can monitor your hosts and manage your ntop configuration your admin login.
7. Plugins
The following plugins can be configured for the system through the ntop web interface.
- Host Last Seen: This plugin produces a report about the last time packets were seen from each specific host.A note card database is available for recording additional information.
- icmpWatch: This plugin produces a report about the ICMP packets that ntop has seen. The report includes each host, byte and per-type counts (sent/received).
- snmpPlugin: This plugin is used to monitor host traffic using the SNMP protocol.
- Round Robin Database: This plugin is used to setup, activate and deactivate ntop’s rrd support. This plugin also produces the graphs of rrd data, available via a link from the various ‘Info about host xxxxx’ reports.
- NetFlow: This plugin is used to setup, activate and deactivate NetFlow support. ntop can both collect and receive NetFlow V1/V5/V7/V9 and IPFIX (draft) data. Received flow data is reported as a separate ‘NIC’ in the regular ntop reports.
- sFlow: This plugin is used to setup, activate and deactivate ntop’s sFlow support. ntop can both collect and receive sFlow data.
- PDAPlugin: This plugin produces a minimal ntop report, suitable for display on a pda.
8. Screenshots
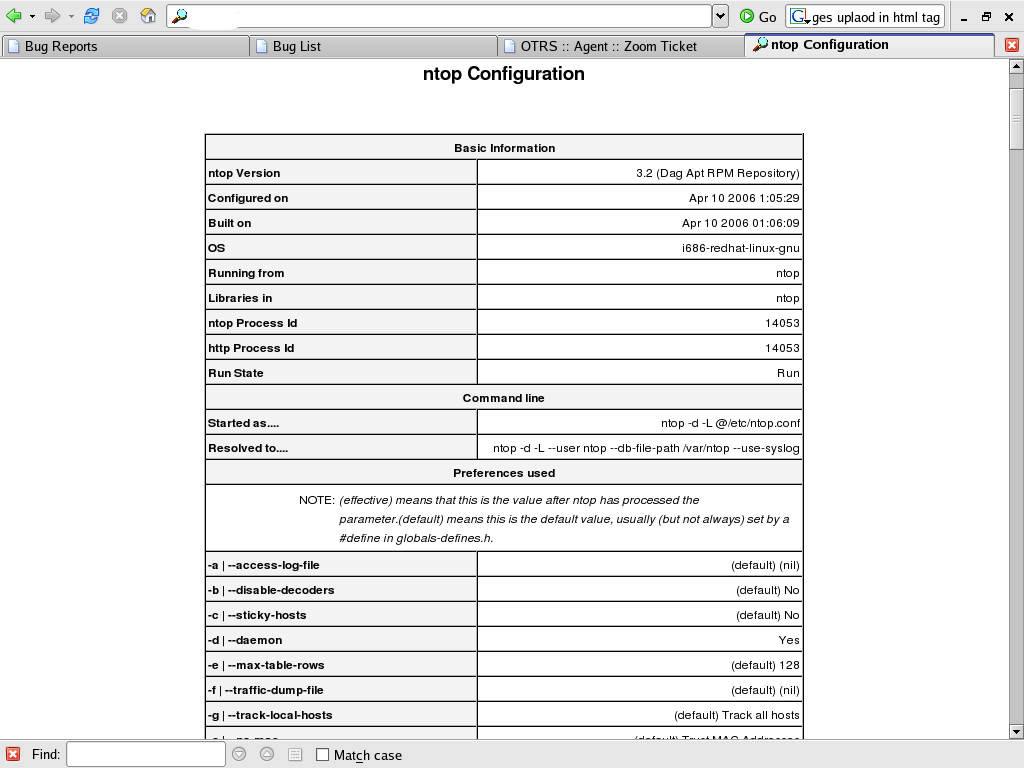
1.ntop Configuration:
2. Global Traffic Status:
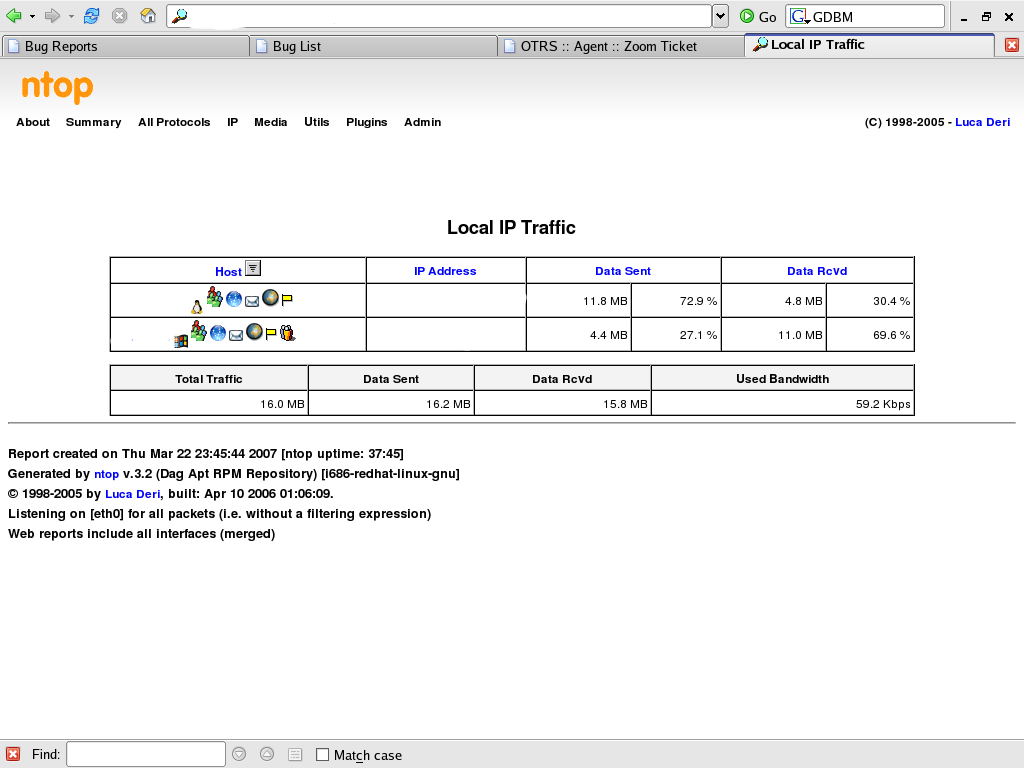
3. Local IP Traffic:
4. Traffic Report for eth0:
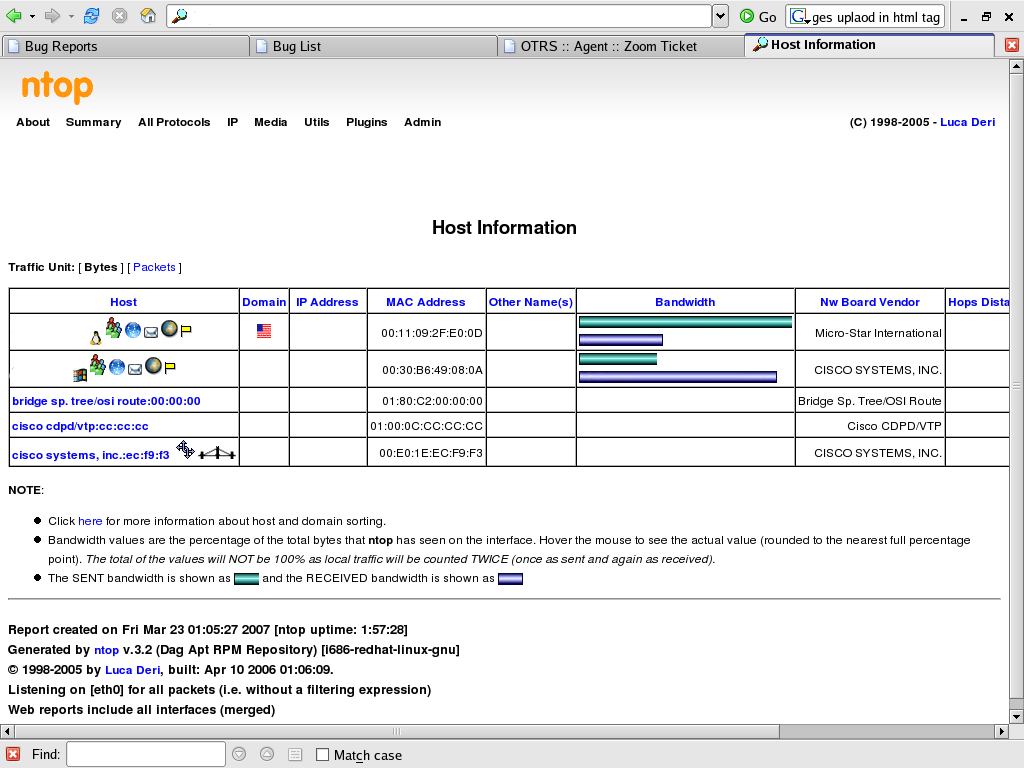
5. Host Information:
6. Network Load Statistics:
9. References
 About the author:
Savitha Nair works as Sr. Software Engineer (Grade II) in Bobcares.com.
Savitha has worked in Bobcares for 3 years and is a passionate advocate of
secure linux server administration.


Hi
Installation stopped with dependencies error,
[root@ns tmp]# rpm -ivh ntop-3.3-1.el5.rf.i386.rpm –test
error: Failed dependencies:
librrd_th.so.2 is needed by ntop-3.3-1.el5.rf.i386
Hello Melbin,
The rrdtool is available with ntop-3.3-1. Please try to download from http://rpm.pbone.net/index.php3/stat/4/idpl/5091876/com/ntop-3.3-1.el5.rf.i386.rpm.html and install. If you stuck with the error, please install the rrdtool-1.2.13 and proceed with the installation.
Hi Savitha, thanks for all the info
I need to monitor the LAN/WAN traffic in the following layout
WAN — ISP Router —- Firewall — LAN Core_Switch —- Servers
Where to put the host that runs NTOP?
Do I need to configure a span port? Do I need a tap?
Thanks in advance for the help.
Jose.
Hi Savitha
Great article, very useful.
The link http://ntop.ethereal.com/ntop.html is no longer available.
Another great post.
Thanks for the tips and help.
Everyone, bookmark this site.
Hello Saurabh,
Are you getting any error? If you can provide me the error, I can help you with that. For the configuration part, you can check the configuration using GUI. The actual file is /etc/ntop.conf. In order to assist you on this configuration part, let me know the exact requirement, I will help you with the configuration. Else you can use teh default configuration.
I know this is old, but I’ve looked everywhere. I have installed ntop onto my Ubuntu server and it seems to be only monitoring my WAN side but not giving me internal traffic statistics (ETH1) does anyone know how to configure it so that it’s monitoring both ETH0 (WAN) and ETH1 (LAN)
ntop has this command line option of :
-i | –interface
Use this optional parameter to specify the network interface or interfaces to be used
by ntop for network monitoring. If multiple interfaces are used their names must be
separated with a comma. For instance -i “eth0,lo,eth2”.
By default, the configuration would be for the first ethernet device. You can edit the ntop configuration file, typically /etc/ntop.conf to change this.
Replacing the line :
–interface eth0
with
–interface eth0,eth1
Thanks so much. I had ended up figuring thems out after I posted this and got it monitoring both eth1 and eth0. I didn’t think of monitoring the loopback… I might try it.. kinda curious to see what it shows
Hi ,
I want to monitor FTP traffic bandwidth(required graph too) on port 20,21 on interfaces using NTOP but I do not see any option.Any one suggest how to monitor the same using ntop?
Appreciate your help. OR any other open source tool ?
Thanks in advanced.
Vishal
HI,
links
ftp://download.fedora.redhat.com/pub/fedora/linux/core/4/SRPMS/glib-1.2.10-16.src.rpm
and
http://dag.wieers.com/rpm/packages/ntop/ntop-3.2-1.el3.rf.i386.rpm
are both broken when i tried them out. here’s is my output
$ wget ftp://download.fedora.redhat.com/pub/fedora/linux/core/4/SRPMS/glib-1.2.10-16.src.rpm
–2012-07-04 09:45:49– ftp://download.fedora.redhat.com/pub/fedora/linux/core/4/SRPMS/glib-1.2.10-16.src.rpm
=> “glib-1.2.10-16.src.rpm”
Resolving download.fedora.redhat.com… failed: Name or service not known.
wget: unable to resolve host address “download.fedora.redhat.com”
and
Resolving apt.sw.be… failed: Name or service not known.
wget: unable to resolve host address “apt.sw.be”
Hi Savita,
I have basic doubt. If I want to monitor the LAN Subnet traffic connected with switch using nTop, on which host should I install the nTop.
configure ntop in such a way that an alarm (email) is raised/sent when a particular uses sends too many broadcast packets or uses too much bandwidth