Setting up a Kubernetes Cluster and monitoring it with Ansible, Prometheus, and Grafana is easy with help from our Kubernetes Support team.
Setting Up a Kubernetes Cluster and Monitoring with Ansible, Prometheus, and Grafana
In the ever-evolving landscape of IT infrastructure, the deployment and management of containerized applications have become crucial. This case study takes a look at a real-world project that establishes a Kubernetes cluster with kubeadm and streamlines the process with the power of Ansible automation.
Our expert, Syam is going to take us on a journey through the challenges faced, solutions implemented, and the insights gained in monitoring the cluster’s health with Prometheus and Grafana. YOu will no longer have any trouble with setting up a Kubernetes Cluster and monitoring it with Ansible, Prometheus, and Grafana.
In this project, he established a Kubernetes cluster with kubeadm and Ansible. The goal was to create a cluster architecture consisting of one master node and two worker nodes.
Furthermore, it involved configuring Prometheus and Grafana to monitor both the application and the cluster. This is done by installing them from the Prometheus-Grafana stack package. Hence they get to run as pods within the cluster.
Additionally, our expert went a step further to assess performance differences between local persistent storage and remote NFS storage by setting up an NFS storage class. This involved creating a separate NFS server, which was then mounted to the cluster as a storage class.
Installing Ansible on the local machine
To streamline the setup process, our expert used Ansible to manage the deployment of the Kubernetes cluster. Kubeadm, plays a key role in ensuring the smooth integration of the master and worker nodes.
# Install Ansible locally

sudo apt install ansible
However, our Support Expert ran into trouble during the installation. The following error message lets us know that Ansible requires UTF-8 as the locale encoding, but it detected ISO8859-1.
To overcome this, we can run this command:
export LC_CTYPE=en_US.UTF-8
Furthermore, we can make this change permanent by adding the line `export LC_CTYPE=en_US.UTF-8` to the `~/.bashrc` file.
Kubernetes Cluster with kubeadm – Installation via Ansible
Now, we are going to move on to setting up a Kubernetes Cluster. We have to ensure there is seamless communication between the Ansible host and the master/worker nodes.
Before we begin, here are the Master and worker nodes:
- Master: 172.16.5.172
- Worker 1: 172.16.5.138
- Worker 2: 172.16.5.174
Now, Syam, our Support expert proceeds to disable swap in the Kubernetes cluster. This plays a key role in optimal performance and stability.
Kubernetes depends on efficient resource management and stable node memory. However, when we enable swap it introduces performance overhead and also interferes with container resource isolation. This will most probably lead to unpredictable behavior. It affects pod scheduling decisions and as well as affect the Out-Of-Memory (OOM) handling mechanism.
This is why our expert suggests disabling swamp on cluster nodes.
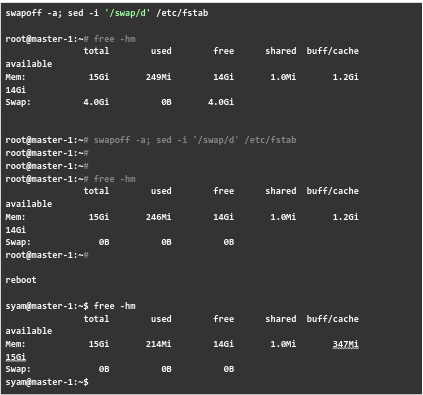
Then, it is time to establish the connection between the Ansible host and Kubernetes master and worker nodes.
This involves creating a key and and using it as the authorized key in all the servers as seen in the image below:
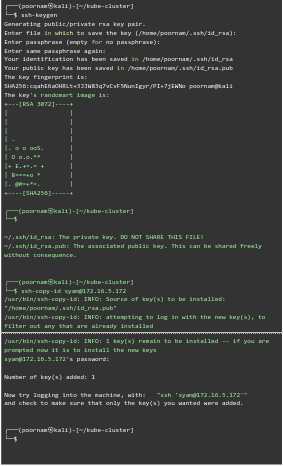
We have to repeat the procedure for all the servers.
In case we run into the following error, it means that the root access has not been set up.

In this scenario. Our expert recommends opening the /etc/ssh/sshd_config file and changing PermitRootLogin to “Yes”.
Then, set the root password by running the passwd command.

After that, we have to restart the ssh and copy the key for the root user as seen here:

Then, we can try to log into the machine, with this command:
ssh 'root@172.16.5.138’We can also verify that only the key(s) we wanted were added.
Step-by-Step guide: setting up a Kubernetes cluster using Ansible
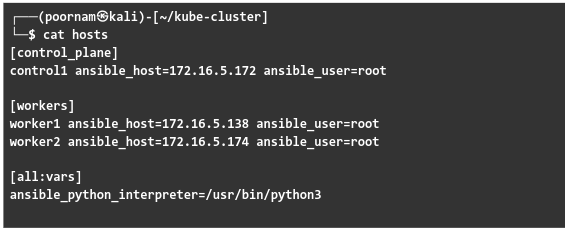
- To begin with, we have to set up the Workspace Directory and Ansible inventory file.
This involves creating a directory structure for the Kubernetes cluster and defining the Ansible inventory file (hosts) with control panel and worker nodes.
- Next, we have to create a non-root user on all remote servers. We can use the Ansible playbook (initial.yml) to create a non-root sudo user (ubuntu) on all remote servers.
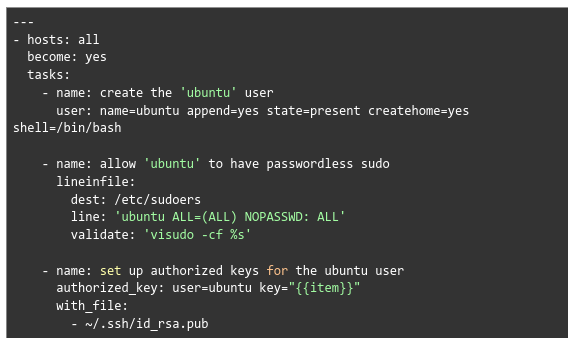
Additionally, we also have to configure passwordless sudo and set up authorized keys for the new user.
- Then, we have to run the script:
ansible-playbook -i hosts initial.ymlNow ubuntu user is created on all servers.
- Now, we will move on to installing Kubernetes dependencies. This process uses the Ansible playbook (kube-dependencies.yml) to install Docker, APT Transport HTTPS, and Kubernetes components on all nodes. Furthermore, it configures Docker to use systemd as the driver.
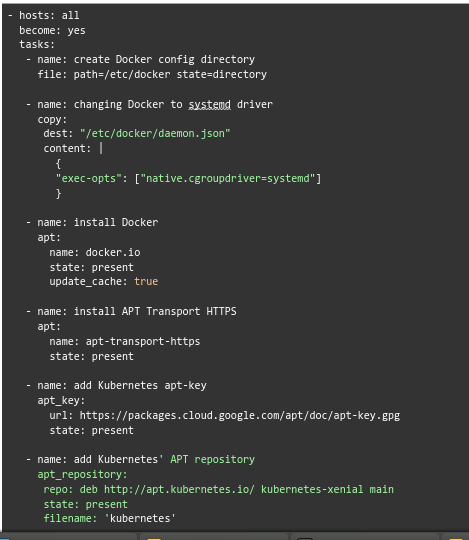
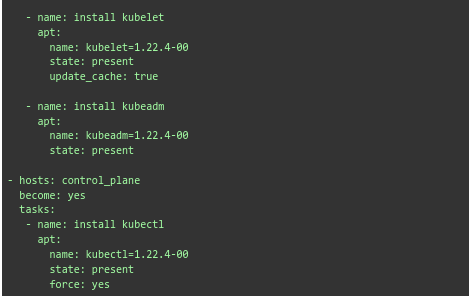
- Then we have to run this command to execute the playbook:
ansible-playbook -i hosts ~/kube-cluster/kube-dependencies.yml - After that, we have to set up the Control Plane node. This process uses the Ansible playbook (control-plane.yml) to start the Kubernetes cluster on the control plane node. It creates the .kube directory, copies admin configuration, and installs the Pod network (Flannel).
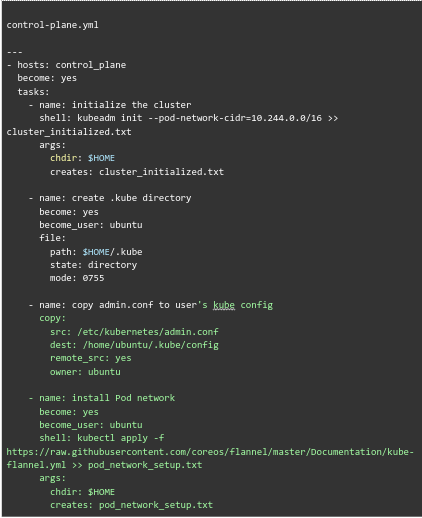
- Then, execute the playbook:
ansible-playbook -i hosts control-plane.ymlFurthermore, we can use Ansible playbook (workers.yml) to get the join command on the control plane node.
ansible-playbook -i hosts workers.yml - Now, we have to log in as an ubuntu user and interact with the cluster with kubeclt.
We can run this command to get information about the nodes in the cluster:
kubectl get nodes
- Next, run the following command to get information about the pods in the kube-system namespace in our cluster:
kubectl get pods -n kube-system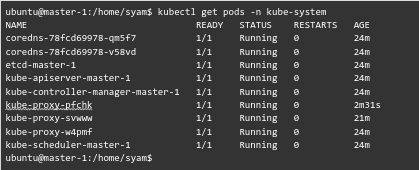
Deploying WordPress on Kubernetes Cluster
Next, our expert got ready to deploy a WordPress site to the Kubernetes cluster. These deployment files are manually created.
Here is a list of the files and directories in the current directory:
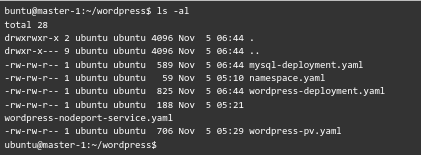
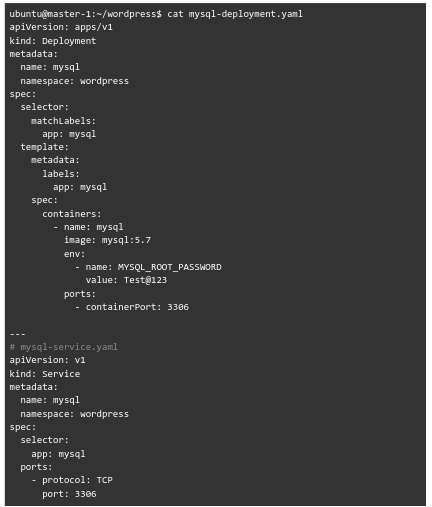
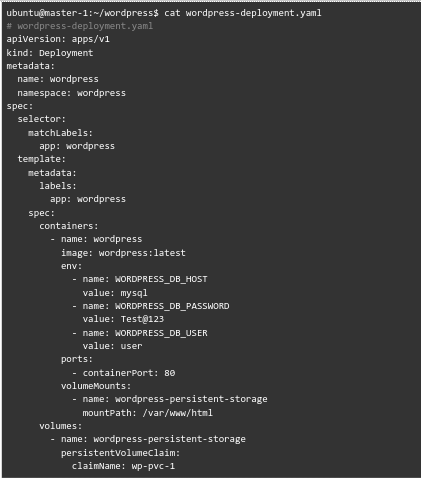
Now, here is a look at the content of these files:
- namespace.yaml

- wordpress-pv.yaml
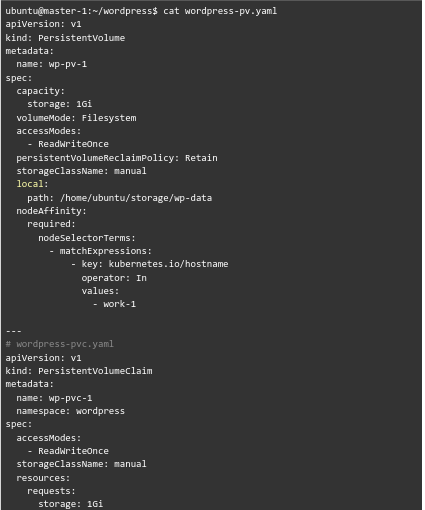
- mysql-deployment.yaml
- wordpress-deployment.yaml
- wordpress-nodeport-service.yaml
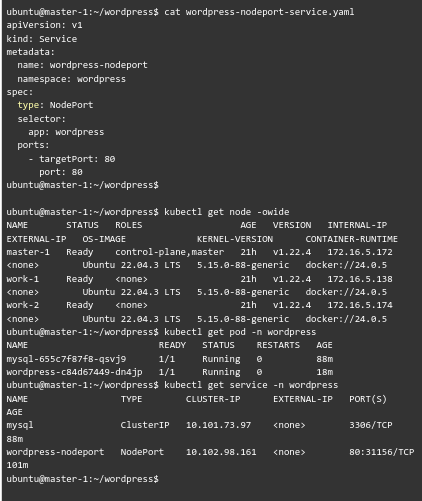
Our expert would like to point out that we have a database in the mysql pod.
For example:
CREATE DATABASE ;

CREATE USER ''@'%' IDENTIFIED BY 'Test@123';

GRANT ALL PRIVILEGES ON wordpress.* TO 'Test@123'@'%';

FLUSH PRIVILEGES;
Monitoring the Cluster
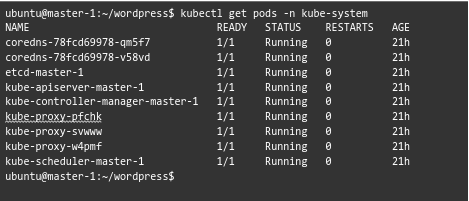
After monitoring the cluster for 21 hours, our expert determined that the cluster is stable with no restarts in the kube-system pods.
Local Persistent Volume
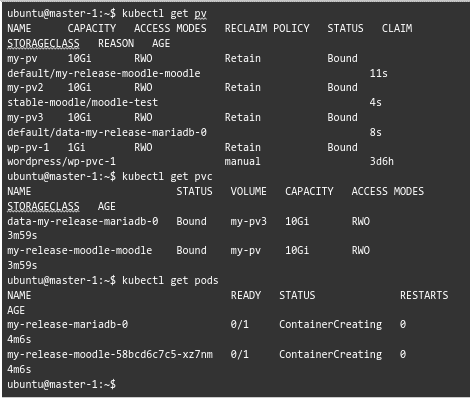
Now, our experts created 3 persistent volumes as seen here:
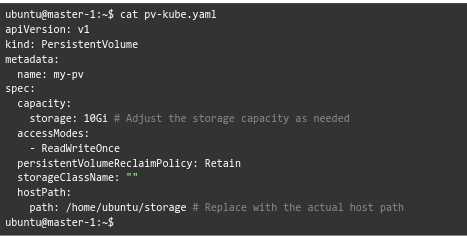
Here is a sample of the content:
Furthermore, the Persistent Volumes are in the Bound state. In other words, these Pvs have been successfully bound to a Persistent Volume Claim (PVC).
However, if a pod has unbound immediate PersistentVolumeClaims, we will get a warning message.
In this case, we can try PVC binding with manual YAML Configuration.
When we manually create a PVC named local-path-pvc with a StorageClass of local-path, the PVC gets successfully bound, and a corresponding PV is automatically allotted.
This behavior is expected when we use dynamic provisioning with a StorageClass that supports automatic PV creation.
Our Support expert modified the helm to use this storage class and installed Moodle.
Configuring Prometheus & Grafana
As we have to monitor the kube-controller-manager and kube-scheduler, we have to expose them to the cluster.
By default, kubeadm runs these pods on our master and is bound to 127.0.0.1. We can change it to “0.0.0.0” as seen here:


We can install Prometheus from this link. https://github.com/prometheus-operator/prometheus-operator
However, when our experts tried this, they found that the data for installing some modules like node exporer, prometheus-operator were not present in cloned git code.
So now, we have to install the full stack from the repository. Link https://prometheus-community.github.io/helm-charts
Then we can add Prometheus Community Helm Charts repository:
helm repo add prometheus-community https://prometheus-community.github.io/helm-chartsAfter that, update Helm repositories:
helm repo updateNext, we can install kube-prometheus-stack:
helm install monitoring prometheus-community/kube-prometheus-stackNow, we can expose grafana as seen here:

Then run the following command to list all the services in your Kubernetes cluster.
kubectl get svcHow to access the data
- First, head to the Home Toggle Menu.
- Then, Expand General after clicking Dashboard.
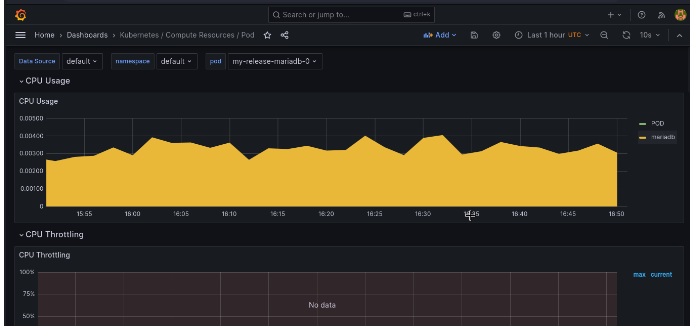
- We can click on different dashboards to see the data of cluster health.
Now the Prometheus & Grafana Monitoring system is live.
Using Shared Storage
To utilize EFS as storage for the cluster, we can mount the EFS file system on our local machine. Here are the steps to create a test EFS file system on AWS and mount it using both the EFS mount helper and the NFS client.
- First, create a test EFS File System on the AWS account:
Name: EFS-storage (fs-0e83034a5971d3863) - Then, mount EFS with the EFS Mount Helper:
sudo mount -t efs -o tls fs-0e83034a5971d3863:/ efs - Next, we have to mount EFS with NFS Client:
sudo mount -t nfs4 -o nfsvers=4.1,rsize=1048576,wsize=1048576,hard,timeo=600,retrans=2,noresvport fs-0e83034a5971d3863.efs.us-east-1.amazonaws.com:/ efs - Now, we must install NFS Client on the local machine:
sudo apt-get install nfs-common

mkdir efs-mount-point - Next, we can mount EFS with NFS on the local machine:
sudo mount -t nfs4 -o nfsvers=4.1,rsize=1048576,wsize=1048576,hard,timeo=600,retrans=2,noresvport fs-0e83034a5971d3863.efs.us-east-1.amazonaws.com:/ efs-mount-point
[Need assistance with a different issue? Our team is available 24/7.]
Conclusion
In brief, our Support Experts demonstrated how to set up a Kubernetes Cluster and monitor it with Ansible, Prometheus, and Grafana
PREVENT YOUR SERVER FROM CRASHING!
Never again lose customers to poor server speed! Let us help you.
Our server experts will monitor & maintain your server 24/7 so that it remains lightning fast and secure.


0 Comments