Learn how to setup Filebeat on Windows Elasticsearch Command line. Our Windows Support team is here to help you with your questions and concerns.
How to Setup Filebeat on Windows Elasticsearch Command line
Filebeat can be described as a lightweight and open-source log shipper. It is provided by Elastic and is to forward log data from different sources to Elasticsearch or other log management systems like Logstash or Kafka.
Elastic Stack is made up of a group of products that access data from any source in any format. Furthermore, it helps search, analyze, as well as visualize it in real time. Elastic Shack is made up of these three main components and the beat family:
- Elastic Search: Search and analytics engine
- Kibana: Dashboard to visualize data
- Logstash: Data processing pipeline
Elasticsearch is a distributed, RESTful search and analytics engine. It deals with a large number of use cases.
In fact, Elasticsearch plays a key role in the heart of the Elastic Stack. It stores user data centrally for search, relevancy, and analytics that is highly scalable.
If you are looking for a guide to help you set up Filebeat on Windows and connect it to Elastic Stack, you have come to the right place. Here is a quick overview of what we will be taking a look at:
- Filebeat Installation
- Connecting to the Elastic Stack
- Log Data Collection
- Setting Up Assets
- Starting Filebeat
- Viewing Data
- Troubleshooting Tips
1. Filebeat Installation
The first step is to install Filebeat on all the servers we want to monitor.
- First, download the Filebeat Windows zip file from this link.
- Then, it is time to extract the contents of the file into C:\Program Files.
- Next, rename the filebeat-version-windows directory to Filebeat.
- We have to open a PowerShell prompt as an Administrator and run these commands:
PS > cd 'C:\Program Files\Filebeat'

PS C:\Program Files\Filebeat> .\install-service-filebeat.ps1
However, if script execution is disabled on our system, we have to set the execution policy for the current session so that the script can run.
For example:
PowerShell.exe -ExecutionPolicy UnRestricted -File .\install-service-filebeat.ps1.
2. Connecting to the Elastic Stack
Now, we have to configure connections to Elasticsearch and Kibana to set up Filebeat. This involves setting the connection information in filebeat.yml.
- To begin with, locate the configuration file in the Directory layout.
- Next, mention the cloud.id of our Elasticsearch Service, and then set cloud.auth to a user authorized to set up Filebeat.
For instance:
cloud.id: "staging:dXMtZWFzdC0xLmF3cy5mb3VuZC5pbyRjZWM2ZjI2MWE3NGJmMjRjZTMzYmI4ODExYjg0Mjk0ZiRjNmMyY2E2ZDA0MjI0OWFmMGNjN2Q3YTllOTYyNTc0Mw=="

cloud.auth: "filebeat_setup:PASSWORD"
We can see a hard-coded password above. Our experts recommend storing sensitive values in the secrets keystore.
3. Log Data Collection
We can collect log data with Filebeat via one of these methods:
- Data collection modules
Filebeat comes with predefined data collection modules that simplify the process of collecting, parsing, and visualizing log data from common sources and formats. These modules are designed to handle specific log types, making it easier for users to set up log collection without extensive configuration.
- ECS loggers
ECS is a common data model for logs that provides a consistent and normalized structure for log entries. Filebeat can be configured to structure and format application logs into ECS-compatible JSON. This makes sure that log entries adhere to a standardized schema, making it easier to analyze and correlate data across different applications.
- Manual Filebeat configuration
In cases where predefined modules or ECS loggers may not be suitable, we can manually configure Filebeat. This involves specifying input sources, defining how the data should be processed, and specifying the output destination.
3.1 Enabling and Configuring Data Collection Modules
We can easily enable and configure data collection modules as seen below:
- First, identify the modules we want to enable. We can get the list of available modules by running:
DEB RPM MacOS Brew Linux Windows

PS > .\filebeat.exe modules list - Now, we can enable one or more modules from the installation directory.
For example, this command enables the nginx module config:
DEB RPM MacOS Brew Linux Windows

PS > .\filebeat.exe modules enable nginx
In the module config under modules.d, we have to change the module settings to match our environment.
For instance, log locations are set based on the OS. If our logs aren’t in the default locations, we have to set the paths variable as seen here:
- module: nginx

access:

var.paths: ["/var/log/nginx/access.log*"]
3.2 Enabling and Configuring ECS Loggers for Application Logs
Although Filebeat can accept raw, plain-text application logs, our experts recommend structuring our logs. This lets us easily extract fields.
Furthermore, Elastic simplifies this process by offering application log formatters. These plugins format our logs into ECS-compatible JSON. This helps us avoid manually parsing logs.
3.3 Manual Configuration with Filebeat
If we cannot find a module for our file type, or change our application’s log output, we can enable and configure Filebeat manually.
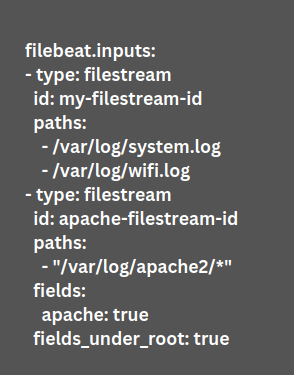
To do this, we have to specify a list of inputs in the filebeat.inputs section of the filebeat.yml. These inputs mention how Filebeat will locate and process input data.
Additionally, the list is a YAML array, hence each input begins with a dash (-) symbol. We can also specify multiple inputs, and specify the same input type more than once.
Here is an example:

Furthermore, each filestream input needs a unique ID for tracking the state of files.
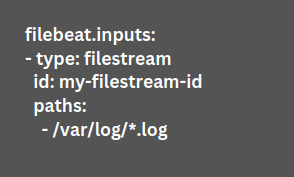
For the most basic configuration, define a single input with a single path. For example:

Here, the input harvests all the files in the path /var/log/*.log. In other words, Filebeat harvests all files in the directory /var/log/ that ends with .log.
Furthermore, we can fetch all files from a predefined level of subdirectories with this pattern: /var/log/*/*.log.
4. Setting Up Assets
Filebeat comes with predefined assets. They help parse, index, and visualize our data. We can load these assets as seen here:
- First, ensure the user mentioned in filebeat.yml has permission to set up Filebeat.
- Then, run this command from the installation directory:
DEB RPM MacOS Brew Linux Windows

PS > .\filebeat.exe setup -e
Here, -e is optional. It sends output to standard error rather than configured log output.
As seen here, these steps load the recommended index template for writing to Elasticsearch. Additionally, it deploys the sample dashboards to help visualize the data in Kibana.
However, we do not load the ingest pipelines used to parse log lines here. By default, ingest pipelines are set up automatically when we run the module for the first time and connect to Elasticsearch.
5. Starting Filebeat
Before we start Filebeat, we have to change the user credentials in filebeat.yml and mention a user who has permission to publish events.
Then, run these commands to start Filebeat:
DEB RPM MacOS Brew Linux Windows

PS C:\Program Files\filebeat> Start-Service filebeat
Our experts would like to point out that the files are stored at C:\ProgramData\filebeat\Logs by default.
Now, Filebeat will start streaming events to Elasticsearch.
6. Viewing Data
- First, log in to our Elastic Cloud account and head to the Kibana endpoint in our deployment.
- Then, click Discover in the side navigation.
- We can see Filebeat data by making sure the predefined filebeat-* index pattern is selected.
In case we do not see the data in Kibana, modify the time filter to a larger range. By default, Kibana displays the last fifteen minutes.
- Then, click Dashboard and choose the dashboard we want to open.
7. Troubleshooting Tips
If we run into trouble starting filebeat, we can use these commands below to troubleshoot.
First, let’s make sure the configuration file is syntactically correct. We can do this by running filebeat directly inside the terminal.
In case the file is invalid, filebeat will display an error loading config file error message. This message will contain further information about the error and how to fix it.
- For deb/rpm
sudo filebeat -e -c /etc/filebeat/filebeat.yml - For macOS
cd EXTRACTED_ARCHIVE

sudo ./filebeat -e -c filebeat.yml - For Windows
cd EXTRACTED_ARCHIVE

.\filebeat.exe -e -c filebeat.yml
At the end of the day, collecting Elasticsearch log data is simplified by setting up Filebeat. Let us know in the comments if you run into any trouble during the setup process.
[Need assistance with a different issue? Our team is available 24/7.]
Conclusion
In brief, our Support Experts demonstrated how to set up Filebeat on Windows Elasticsearch Command line.
PREVENT YOUR SERVER FROM CRASHING!
Never again lose customers to poor server speed! Let us help you.
Our server experts will monitor & maintain your server 24/7 so that it remains lightning fast and secure.


0 Comments