


Install the DigitalOcean Metrics Agent to monitor your server performance easily. Our DigitalOcean Support team is ready to assist you.
Install the DigitalOcean Metrics Agent
Monitoring your server’s performance is crucial for smooth operation and quick troubleshooting. Enabling the Metrics Agent during Droplet creation ensures your server starts sending real-time data immediately. Whether you use the Control Panel, API, or CLI, this setup saves time and provides instant insights into CPU, memory, and disk usage, helping you keep your server secure and efficient from the start.
Enable Metrics Agent During Droplet Creation
One of the simplest ways to start monitoring your server is by enabling the DigitalOcean Metrics Agent at the time of Droplet creation. Doing this ensures that you don’t have to install the agent later, and your server will begin sending performance data right away.
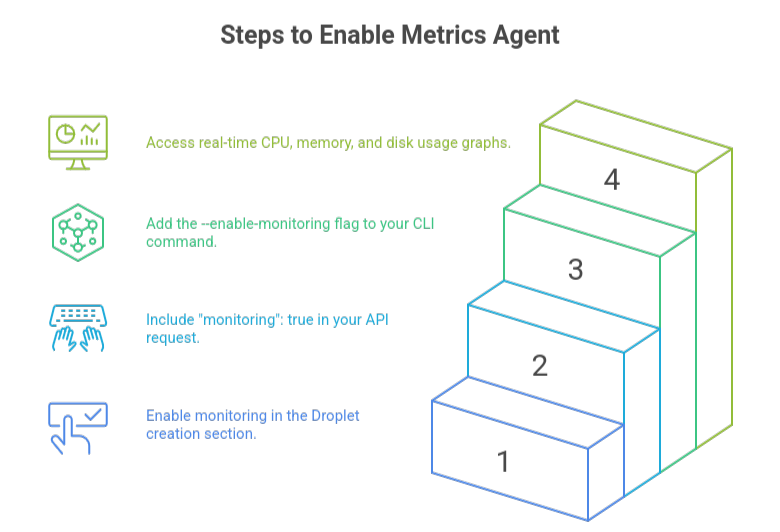
You can enable monitoring in three different ways:
- Control Panel: While creating a Droplet, scroll to the We recommend these options section and check Enable Monitoring. The agent will be installed automatically during setup.
- API: If you’re deploying through the API, include “monitoring”: true in your request. This small addition activates monitoring as soon as the Droplet is created.
- CLI: Developers using the doctl CLI can simply add the –enable-monitoring flag to their command. This ensures the agent is installed as part of the provisioning process.
By enabling the Metrics Agent during creation, you save time, avoid extra steps, and gain immediate access to real-time CPU, memory, and disk usage graphs inside the DigitalOcean Control Panel.
Installing the Metrics Agent with Script
If you forgot to enable monitoring during Droplet creation, you can still set it up quickly by installing the DigitalOcean Metrics Agent with a script. This method is simple, secure, and ensures your server starts sending data in just a few minutes.
Step 1: Connect to Your Server
Begin by connecting to your Droplet through SSH. On Linux, use the following command:
ssh root@your-server-ipMake sure you have the necessary permissions, such as sudo access, to run the installation successfully.
Step 2: Download the Installation Script
The fastest way to install the agent is to use the official script provided by DigitalOcean. You can download and run it in one step with this command:
curl -sSL https://repos.insights.digitalocean.com/install.sh | sudo bashStep 3: Review the Script Before Running
For added security, it is always a good idea to review the script before executing it. Instead of running it directly, save it first, check the contents, and then install it:
curl -sSL https://repos.insights.digitalocean.com/install.sh -o install.sh

less install.sh

sudo bash install.sh
Step 4: Run the Script
After reviewing, go ahead and run the script. It will automatically install the Metrics Agent, configure it, and start the service in the background without any extra steps.
Step 5: Verify the Installation
Once the installation completes, confirm that the Metrics Agent is running with the following command:
systemctl status do-agentIf the status shows active and running, the agent is successfully installed and working.
Check out our step-by-step guide to migrating WordPress to DigitalOcean.
Verifying the Metrics Agent is Running
After you install the Metrics Agent, the next step is to make sure it is active and reporting data correctly. Verifying the installation not only gives you peace of mind but also ensures your server monitoring is working as expected.
Check the Service Status
On most Linux distributions that use systemd, you can confirm that the agent is active by running:
systemctl status do-agentIf the output shows Active and running, then the service is working properly.
>You can also check the process list to confirm that the agent is running in the background:
ps aux | grep do-agentThis command will show the agent process if it is currently active.
Confirm Data in the Dashboard
Once the service is running, log in to the DigitalOcean Control Panel and open the Graphs tab for your Droplet. If the agent is installed correctly, you should see performance metrics such as CPU usage, memory usage, and disk activity appear within a few minutes.
Review the Logs
If you do not see data in the dashboard, it is a good idea to review the agent logs. Logs provide details on whether the service is reporting metrics successfully or if there are errors that need fixing. The location of log files may vary depending on your setup, but checking them will help you identify and resolve issues quickly.
Learn everything you need to know about DigitalOcean managed database backups.
Install Metrics Agent from Repository
If you prefer more control over package management, you can install the Metrics Agent directly from the repository. This method makes it easier to handle updates and ensures you are always using the latest secure version. The process is straightforward but varies slightly depending on your operating system.
Add the Repository
First, add the Metrics Agent repository to your package manager. On Ubuntu or Debian, you can create a configuration file inside the sources list directory and include the DigitalOcean repository address. For CentOS and Fedora, you need to create a repository file inside the yum repos directory and specify the base URL for the package source.
Import the GPG Key
Once the repository is added, import the GPG key to verify that the packages you download are authentic. This step is important because it guarantees that the software comes directly from DigitalOcean without being tampered with. On Debian or Ubuntu, you can use curl combined with apt key add, while CentOS and Fedora systems rely on rpm import.
Update the Package List
After setting up the repository and key, refresh your package list so your system can recognize the newly added source. On Ubuntu or Debian, you can run the apt update command, while CentOS or Fedora users typically run yum check update.
Install the Agent
Now install the Metrics Agent using your system’s package manager. On Debian or Ubuntu, use the apt install command with the agent name, while on CentOS or Fedora you can run yum install with the package name. The installation will download the agent, configure the necessary files, and prepare the service to run.
Start and Enable the Service
In most cases, the service starts automatically after installation. However, it is a good idea to check its status and make sure it runs on system boot. You can use systemctl commands to verify and enable the agent if needed.
By installing the Metrics Agent through the repository, you gain flexibility, security, and ease of management. This approach ensures your monitoring setup remains reliable and always up to date.
Uninstalling the Metrics Agent
If you decide that you no longer need monitoring on your Droplet, you can easily uninstall the Metrics Agent. This process is simple, but it varies depending on the operating system you are using. By removing the agent, you free up resources and keep your server environment clean.
Confirm Your Operating System
Start by checking which operating system is running on your Droplet. Knowing whether you are using Ubuntu, Debian, CentOS, or Fedora is important because each system uses a different package manager for uninstalling software.
Uninstall on Ubuntu and Debian
On Ubuntu and Debian, you can remove the agent by uninstalling the do agent package. To fully clean up, purge the configuration files as well. Once this step is complete, the service will be disabled and any remaining files will be deleted. If you previously added the repository during installation, remember to remove it from the sources list directory so that your system no longer references it.
Uninstall on CentOS and Fedora
For CentOS and Fedora users, the agent can be removed using the yum package manager. Running the uninstall command stops the service and deletes the package from your system. If you installed the agent by adding a repository file, it is best to delete that file from the repos directory to finish the process.
Verify Successful Removal
After uninstalling, confirm that the agent has been completely removed. You can do this by checking the service status with systemctl. If the system reports that the service cannot be found, the uninstallation was successful.
By following these steps, you can uninstall the Metrics Agent safely and ensure that only the necessary services are running on your Droplet. This keeps your server lightweight, secure, and easier to manage.
Discover how to deploy a backend app on DigitalOcean with managed database integration.
[Need assistance with a different issue? Our team is available 24/7.]
Conclusion
Enabling server monitoring is essential for maintaining performance and security. Whether you set it up during Droplet creation or afterward, following the steps to install the DigitalOcean Metrics Agent ensures your server continuously reports real-time metrics. This makes monitoring simple, efficient, and reliable.
In brief, our Support Experts demonstrated how to fix the “554 5.7.1 : Relay access denied” error.


0 Comments