An EC2 instance without enough free disk space, can crash instantly. That’s why having a proper AWS disk usage monitoring system is vital for EC2 instances.
Amazon provides CloudWatch monitoring script for EC2 Linux-based instances. But it requires additional customization to make it effective for disk usage monitoring.
Today we’ll discuss how we setup disk usage monitoring for AWS EC2 instances using CloudWatch.
1. Install CloudWatch monitoring script
The first step is to install the CloudWatch monitoring script in the EC2 instance.
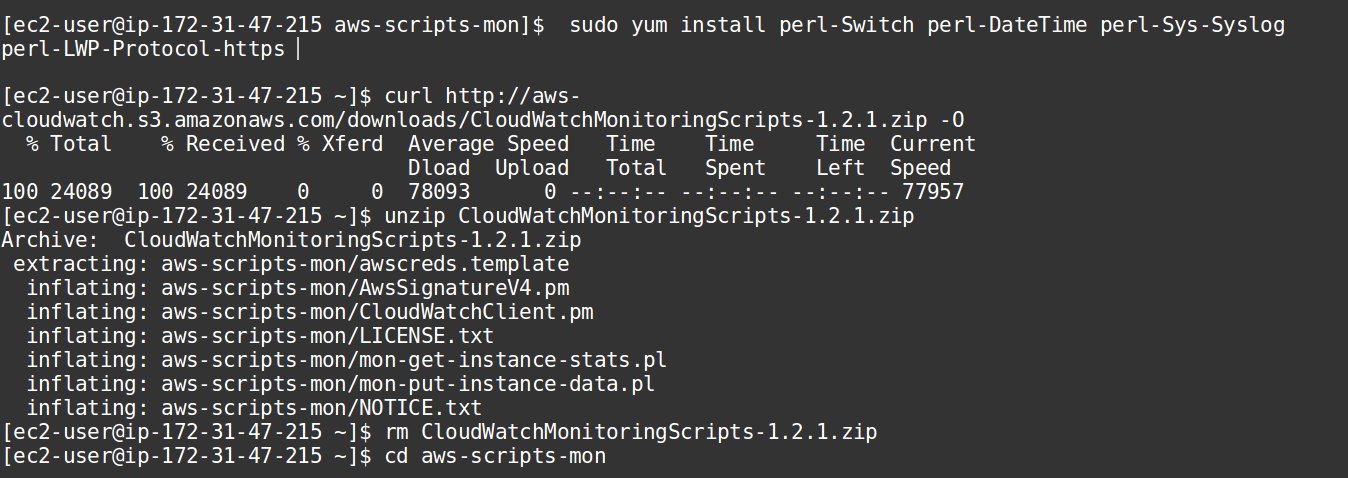
The required perl packages are installed first. Then the CloudWatch script is downloaded and installed:

Install CloudWatch
The two main scripts that are installed are:
- mon-put-instance-data.pl – This script does the data collection. It collects the EC2 metrics such as memory, swap and disk utilization and sends it to the CloudWatch.
- mon-get-instance-stats.pl – This script generates the reports. It queries the CloudWatch and displays the utilization statistics for the EC2 instance for which the script is executed.
Read: How to update PHP to version 5.6 in AWS EC2?
2. Assign privileges to AWS user
Every AWS EC2 instance has a user assigned to it, known as the IAM (Identity and Access Management) user.
To execute CloudWatch scripts, this user should be given the required privileges. This can be done from the AWS management console to manage users.
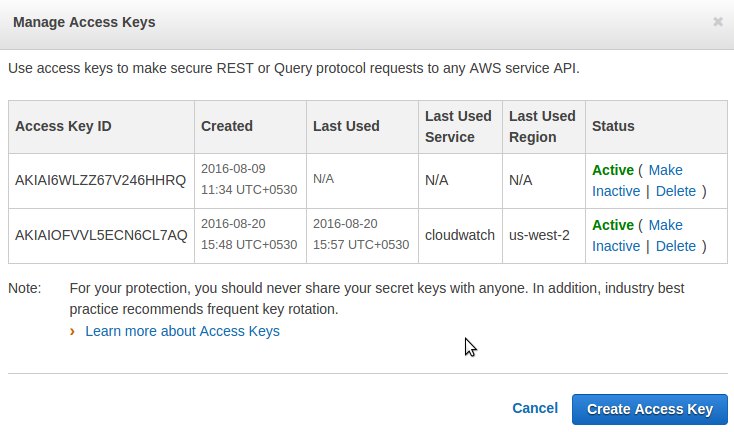
When an access key is created for the user from the AWS console, it will also give a secret key for that user. These two keys are important for CloudWatch configuration.

Access key for user
The access key and the secret key for the user should be specified in the file “awscreds.template”. It may also be given in the command line while executing the scripts.
Once the keys are updated in the template file, the user should now be given the privilege to access the CloudWatch reports.
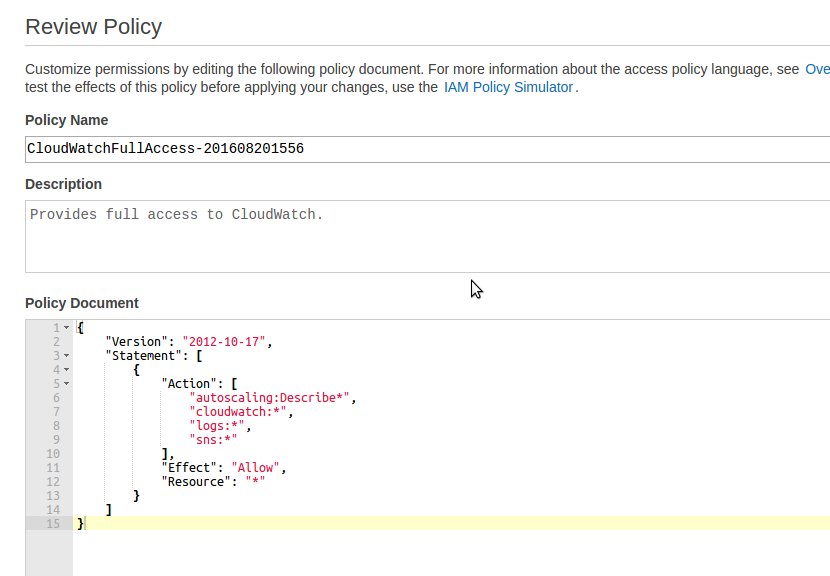
This is done via the ‘Policies’ feature for Users in the AWS management console. Create a new policy for CloudWatch full access:

CloudWatch policy for user
Assign this new policy to the IAM user associated with the EC2 instance:

Assign policy to user
Read: Setting up AWS for HTTP/2 support
3. Generating the disk usage stats
Once the user is assigned privilege to access CloudWatch, we can generate the various stats in a given time period for the EC2 instance using the command:
./mon-get-instance-stats.pl --recent-hours=12 --verbose
The detailed stats for each metric – disk, memory and CPU – can be generated. For instance, a sample disk space utilization statistic would look like:

Disk space usage for EC2 instance
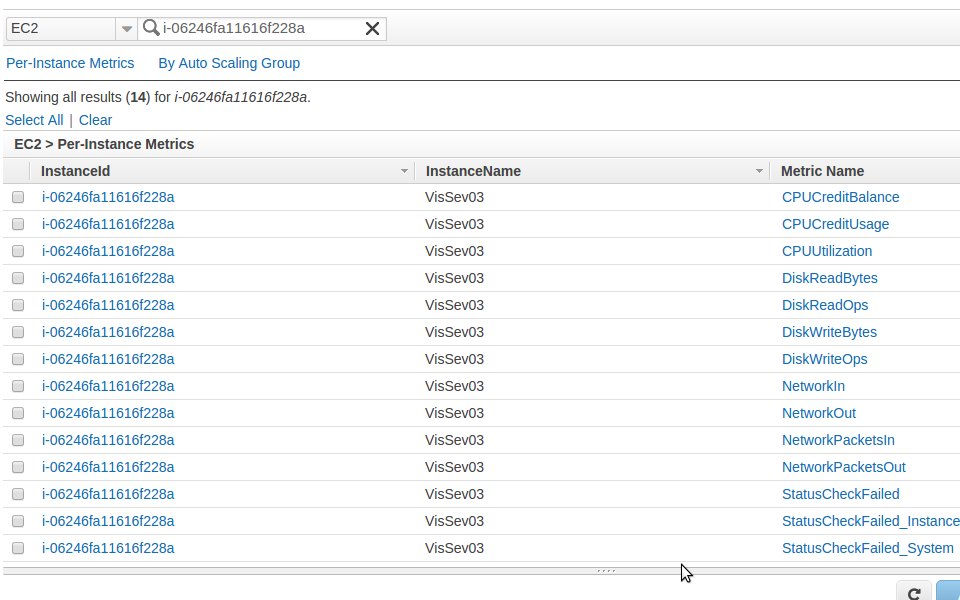
The statistics for each metrics for each EC2 instance can now be viewed from the CloudWatch web console:

CloudWatch metrics
4. Custom scripts for monitoring
CloudWatch has a feature to set ‘Alarms’ to alert when a metric value goes high, say CPU exceeding beyond a limit. But there is no Alarm that is available for disk space utilization.
So we wrote a custom script to check the disk usage utilization from the script output and to alert our 24/7 team of engineers, whenever the disk usage exceeded 75%.
Our support team would then review the disk usage and find ways to reduce it. This includes deleting unwanted folders and doing proactive actions to avoid recurring alerts.
We also setup a cron job that executes every 5 minutes to collect the statistics, so that the stats are always updated. This was setup in all the EC2 instances we are monitoring.

Cron job for monitoring
Read: How to fix ‘Disk usage warning’ alerts in cPanel/WHM servers


0 Comments